Reading Time 7
Number of Words 1416
Google Search Console (GSC) is Google's free tool that lets you monitor how your website appears in search results. However, many website owners open it, see the numbers, and don't quite know what to do with them.
In this guide we explain, section by section, how to read each GSC report and what actions to take to improve your ranking.
What is Google Search Console?
Google Search Console is a free service from Google that helps you monitor and maintain your site's presence in search results, and troubleshoot indexing, crawling, and performance issues.
Unlike Google Analytics —which measures what happens inside your website—, GSC measures what happens before: how many times your website appears on Google, in what position, and whether it has technical problems that prevent robots from crawling it correctly.
To start using it, you need to verify your domain ownership using an HTML tag, a DNS verification file, or through your domain provider.
The Main Reports of Google Search Console
1. Performance Report — The most important
The Performance report (formerly called "Search Analytics") is the starting point for any SEO analysis. It shows data from the last 16 months on how users find your website on Google. The four key metrics are:
-
Clicks: how many times your search result was clicked
-
Impressions: how many times your website appeared in the results, even if the user didn't click on it
-
CTR (Click-Through Rate): the percentage of impressions that resulted in a click. It is calculated as clicks ÷ impressions × 100
-
Average position: the average position your website occupies for each search query.
How should we interpret this data?
The key is to cross-reference metrics. CTR (Click-Through Rate) is the percentage of times users clicked on your result after seeing it on Google. It's calculated very simply: if your page had 1,000 impressions and 20 clicks, your CTR is 2%. A healthy CTR for organic results is usually between 3% and 10% depending on the position, although the first Google result can exceed 25-30%.
A page with many impressions but a low click-through rate (e.g., 1-2%) is a clear sign that users are seeing your result but aren't finding it compelling enough to click. The most common causes are an unengaging title, a generic meta description that doesn't communicate the content's value, or a result that doesn't clearly address the user's search intent. The solution is to rewrite the title, including the main keyword at the beginning, add numbers or power words ("complete guide," "step-by-step," "2026"), and write a meta description that functions as a mini-ad with a clear call to action.
On the other hand, a page ranking 8-15 with a good volume of impressions is in what SEOs call the "hot zone" or "second chance": it's already being crawled and indexed, Google considers it relevant, but it hasn't yet reached the first page. With content improvements—expanding the information, adding sections that answer more related questions, improving the structure with H2/H3 headings, and adding updated data—that result can jump to the top 7 positions and exponentially increase clicks, since organic traffic drops drastically from the second page onward.
💡 Practical tip: Filter by "Pages" and sort by impressions from highest to lowest. Pages with the most impressions and low CTR are your biggest opportunities for immediate improvement.
In December 2025, Google launched an experimental AI-powered configuration feature in the Performance report that allows you to describe in natural language the analysis you want to see, automatically applying filters by query, country, device, or date range.
2. Page Indexing Report — Knowing what Google sees on your website
The Page Indexing report (formerly "Coverage") shows you which pages on your website Google has been able to crawl and index, and which ones it's having problems with. It's divided into four states:
| State | Meaning |
|---|---|
| 🟢 Valid | When indexed correctly, they appear in Google. |
| 🟡 Valid with warnings | Indexed but with some minor issues |
| 🔴 Errors | If they are not indexed, Google cannot process them. |
| ⚪ Excluded | Intentionally not indexed (noindex, canonicals, etc.) |
The most common errors are 404 (page not found), redirect problems, and pages blocked by robots.txt. Fixing these errors quickly is a priority, as they directly prevent your pages from appearing in Google search results.
3. Page Experience Report — UX and Core Web Vitals
Google has used user experience as a ranking factor since 2021, and this report evaluates three technical aspects known as Core Web Vitals:
-
LCP (Largest Contentful Paint): Loading speed of the main element. Must be less than 2.5 seconds
-
INP (Interaction to Next Paint): Response to user interactions. Less than 200 ms
-
CLS (Cumulative Layout Shift): Visual stability of the page. Less than 0.1
URLs are categorized as Good, Need Improvement, or Poor. If you have many URLs in a poor state, tools like Google PageSpeed Insights or the Core Web Vitals report can help you identify and prioritize problems on a page-by-page basis.
4. Sitemaps Report — Make sure Google knows about your website
The Sitemaps report lets you submit your XML sitemap to Google and check if it has been processed correctly. A well-configured sitemap speeds up the discovery of new or updated pages.
If you've just published new content and it hasn't appeared in the index for a few days, checking your sitemap for errors is the first step. In the following article about Sitemaps, we explain everything you need to know.
5. Search Experience Rules Report — Rich Results
This report shows whether your pages meet the requirements to appear in rich results on Google: star ratings, FAQs, breadcrumbs, recipes, etc.
Rich results significantly increase CTR without improving ranking, so implementing structured data (Schema.org) and validating it here is a very cost-effective SEO tactic.
→ Learn more about Structured Data
6. Links Report — Your external and internal authority
The Enlaces report is divided into two sections:
-
External links: which domains link to your website and which pages. Show the anchor text used.
-
Internal links: Which pages on your own site receive the most internal links?
High-quality backlinks are one of the most important ranking factors. Use this report to identify pages with few external references that need a link building strategy. It also detects any suspicious or low-quality domains linking to your website (you can disable them in Google Search Console).
How to Complement GSC with Other Tools
Google Search Console has a significant limitation: it only displays data from Google, not from Bing, Yahoo, or other search engines. Furthermore, its click and impression data is limited to searches where you already have visibility.
For a more comprehensive traffic analysis, you can complement GSC with:
-
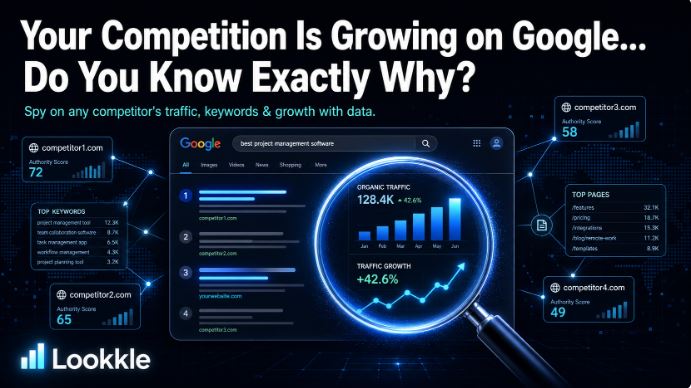
Lookkle — Analyze the estimated traffic of any domain, including your competitors', without needing access to their Google Search Console. Ideal for benchmarking and identifying keywords where your competitors are outperforming you.
-
Bing Webmaster Tools — The equivalent of Google Search Console for Microsoft's search engine, essential if you want organic traffic data from Bing
-
Google Analytics 4 — Connected to GSC, it allows you to see the behavior of users who arrived from organic search.
Recommended Workflow with GSC
Follow this weekly routine to get the most out of Google Search Console:
-
Monday: Review the Indexing report for new critical errors
-
Wednesday: Analyze the Performance report by filtering for the last 7 days and compare it to the previous week.
-
Friday: Identify 3-5 pages with high impressions and low CTR → optimize titles and meta descriptions
-
Monthly: Review the Core Web Vitals report and the external links report.
Common Mistakes When Reading GSC
-
Look only at total clicks: an increase in impressions without an increase in clicks may indicate a drop in rankings
-
Ignore the excluded pages report: sometimes important pages are being accidentally blocked by a
noindexmisconfigured setting -
Don't segment by device: mobile and desktop performance can be very different. Always filter by device to detect specific mobile issues.
-
Confusing average position with actual ranking: average position is an average of all queries, and can be misleading if you have keywords with very disparate performance
Quick Glossary of Google Search Console
| Term | Definition |
|---|
| Term | Definition |
|---|---|
| Impression | Your website appeared in the search results |
| Click | The user clicked on your result. |
| CTR | Percentage of impressions that generated a click |
| Middle position | Average ranking for a query |
| Property | Your website verified on GSC |
| Indexing | Google has processed and saved your page |
| Core Web Vitals | Google user experience metrics |
| Rich Result | Result enriched with structured data |