Reading Time 6
Number of Words 1343

Average time on website is one of the most revealing behavioral metrics available to you. It measures how long visitors stay on your site during a session and is a direct indicator of whether your content is engaging, whether the user experience is working, and whether users are finding what they're looking for.
In 2026, with Google prioritizing behavioral signals and analytics tools being more accessible than ever, understanding and comparing this metric is essential for any serious digital strategy.
What is Average Time on Website
Average time on site (also called average session duration ) measures the total time a user spends on your website from the moment they enter until they leave, calculated as an average over all sessions in a given period.
You shouldn't confuse it with average time on page, which measures how long the user spends on a specific URL before navigating to another.
| Metrics | What does it measure? | Where to watch it |
|---|---|---|
| Average session duration | Total user time on site | GA4, Lookkle |
| Average time on page | Time at a specific URL | GA4, heatmaps |
| Bounce rate | % of single-page sessions | GA4, Lookkle |
| Pages per session | Navigation depth | GA4, Lookkle |
How Much Time Users Spend on a Website: Benchmarks 2026
Before evaluating your own data, you need a benchmark. According to the most recent studies:
-
The average time spent on the page globally is between 52 and 54 seconds.
-
The average session duration across industries is approximately 2 minutes and 17 seconds.
-
The average bounce rate is around 47%.
-
The average number of pages per session is 2.8
However, these global averages aren't enough. What matters is comparing yourself to your specific industry.
Benchmarks by Sector (Average Session Duration)
| Sector | Average session duration |
|---|---|
| Financial services | 4:56 |
| B2B SaaS | 4:26 |
| IT and managed services | 4:16 |
| PCB design and manufacturing | 4:18 |
| Oil and gas | 4:13 |
| Business insurance | 4:06 |
| Real Estate | 3:52 |
| Staffing and HR | 3:48 |
| Pharmacist | 3:47 |
| Manufacture | 3:37 |
| Fintech | 3:28 |
| B2C eCommerce | 2:03 |
| Higher education | 2:25 |
| Automotive | 2:41 |
As a general rule, between 1 and 3 minutes is considered a good time on page, and high-converting sites reach an average of 3 minutes and 36 seconds.
Why This Metric Is Important for SEO
Time spent on site is not a vanity metric. It directly impacts several key aspects:
-
Quality signal for Google: a low time may indicate that the content does not satisfy the search intent
-
Traffic quality: distinguishes between interested visitors and immediate bounces
-
Content optimization: reveals which pages retain users and which pages drive them away.
-
Conversion rate: users who spend more time on the site tend to convert more.
-
Audience segmentation: allows you to identify user profiles with higher engagement
How to Analyze Average Time Spent on Your Website
1. Google Analytics 4
GA4 has recalculated how it measures time on site. It now works with engaged sessions , defined as sessions that last more than 10 seconds, convert , or include at least two page views. The key metrics in GA4 are:
-
Average interaction time: modern equivalent of session duration
-
Engagement rate: percentage of sessions with engagement (inverse of bounce rate)
-
Pages/screens per session
To view it: Reports → Participation → Overview or Pages and Screens
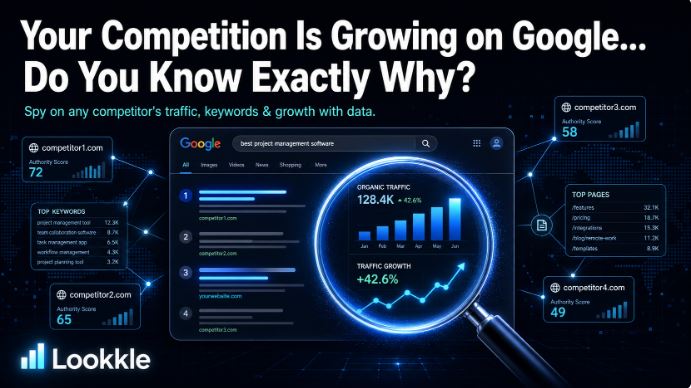
2. Lookkle — Analyze and Compare with Competitors
If you want to go beyond your own data and compare your website's performance with that of the competition, Lookkle is a very powerful tool.
Lookkle allows:
-
View the historical monthly traffic of any website
-
Analyze the breakdown by country, source, device, and behavior
-
Compare your engagement metrics with those of your direct competitors
-
Access organic, daily and monthly visit data updated to the current month
-
Detect traffic spikes and drops related to algorithm updates or campaigns
This is especially useful for sites that want to know if their average time on site is above or below the industry average, without needing access to competitors' GA4 metrics.
3. Heatmaps and Session Recordings
Tools like Hotjar, Microsoft Clarity, or Mouseflow complete the analysis by showing:
-
How far do users scroll?
-
Which areas do they click on?
-
Recordings of real sessions to identify frictions
How to Compare Your Average Time to the Competition
Comparing this metric with websites in your industry is where basic analysis differs from strategic analysis. The recommended process is:
Step 1 — Identify your industry benchmark.
Use the industry benchmark table in this article as an initial reference.
Step 2 — Analyze your competitors with Lookkle
Enter the URLs of your top 3-5 competitors into Lookkle Traffic Checker to see their historical traffic evolution and estimate their engagement level.
Step 3 — Segment by traffic source.
Not all traffic behaves the same. Organic traffic typically spends more time on site than social media traffic, and email traffic surpasses both. Analyze each channel separately.
Step 4 — Analyze by Page Type
Blog, product, category, and home pages have very different behaviors. A 45-second time on a product page might be good; on a 2,000-word article, it's a red flag.
Step 5 — Establish your own historical data
. The most honest comparison is your own month-to-month analysis. Did the time improve after a redesign? Did it decrease after a content change? Lookkle allows you to track this evolution with historical data dating back to 2020.
Factors Affecting Average Time on Site
Factors that reduce it
-
Content that does not match the user's search intent
-
Slow loading speed (every extra second reduces retention)
-
Poor mobile experience
-
Confusing navigation or unclear menu structure
-
Lack of relevant internal links
-
Content that is too short or superficial
Factors that increase it
-
In-depth content that answers real questions
-
Videos embedded on the page
-
Good visual structure: titles, lists, tables, images
-
Internal calls to action to related content
-
Optimized loading speed
-
Intuitive mobile user experience
How to Improve Average Time On Your Website
Improving this metric isn't about tricks, but about creating pages that are truly worth the time spent on. These are the most effective strategies:
1. Improve search intent.
Analyze which keywords drive traffic to each page and ensure the content accurately reflects user search intent. A misalignment between intent and content is the most common cause of slow page load times.
2. Add relevant videos.
Embedded videos significantly increase time on page. A 3-minute tutorial can triple the metric for that URL.
3. Improve internal linking.
At the end of each article, include links to related content. The more a user navigates your website, the longer their overall session duration.
4. Optimize page load speed.
Pages that load in under 2 seconds retain users much more than slow ones. Use Google PageSpeed Insights or Lookkle 's audit tool to detect technical issues.
5. Structure the content visually.
Clear H2/H3 headings, short paragraphs, lists, and tables facilitate reading and encourage the user to continue rather than abandon the page.
6. Add complementary content.
Infographics, calculators, comparison charts, or downloadable resources increase dwell time because they add value on the same page.
What Average Time On Site Should You Aim For
There is no universal magic number. A useful reference point is:
-
Less than 1 minute: red flag; review search intent and content quality
-
Between 1 and 2 minutes: acceptable for many sectors; there is room for improvement
-
Between 2 and 4 minutes: good retention; the content works
-
More than 4 minutes: excellent; typical of sectors with complex content or high-value services
Always remember to compare yourself to your own industry. A fashion eCommerce site with a 2-minute blog post is above average; a B2B SaaS blog with a 2-minute blog post is below average.
Recommended Tools for Analyzing this Metric
| Tool | What it offers | Price |
|---|
| Tool | What it offers | Price |
|---|---|---|
| Google Analytics 4 | own data in real time and historical | Free |
| Lookkle | Own and competitor traffic, historical since 2022 | Freemium |
| Microsoft Clarity | Recordings, heatmaps, behavior analysis | Free |
| Hotjar | Heatmaps, recordings, surveys | Freemium |
| Similarweb | Competitive comparison by sector | Paid |
Conclusion
Average time spent on website is a metric that goes far beyond a number on a dashboard. It reflects the quality of your content, the effectiveness of your user experience, and ultimately, the relevance of your website to your audience.
Analyzing this data with tools like Google Analytics 4 and comparing it with the competition using Lookkle gives you a complete and actionable view: you not only know how you are doing, but also where you need to improve and how far you are from the leaders in your sector.