Reading Time 9
Number of Words 1867
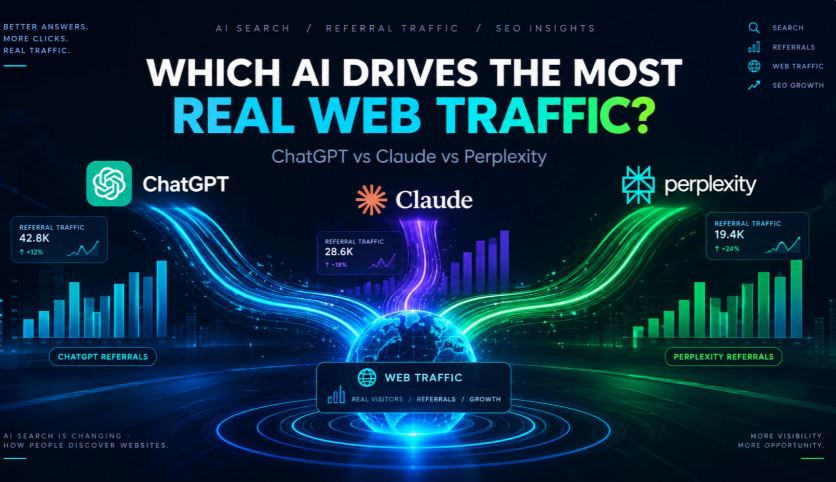
ChatGPT leads in traffic sent to websites by AI assistants, both in the general studies consulted and in the case of howtogeek.com analyzed with lOOkkle. However, the difference with its competitors varies depending on the site and the period: in the breakdown of this technology portal, it concentrates approximately 60% of the users attributed to AI.
For a blogger, a store, or a small business, knowing this distribution helps answer a practical question: which assistants are helping people discover your content?
In this article, we compare general industry benchmarks with three screenshots from lOOkkle on howtogeek.com. We'll see who contributes the most audience, how much weight this channel carries, and what conclusions we can draw without confusing visits, users, and estimates.
What does it mean when an AI sends traffic to a website?
AI-generated referral traffic occurs when a person clicks a link within a wizard and is taken to an external page. For example, someone might search for how to set up a computer, find a guide linked in the answer, and open it to follow the instructions.
This is not the same as counting how many people use ChatGPT, Claude, or Perplexity. Nor is it equivalent to the number of times an assistant mentions a brand.
To understand this, it is helpful to separate three moments:
-
A website appears in a response.
-
The user clicks on their link.
-
That visit generates a result: reading a guide, registering, or buying.
The ranking in this article focuses on the second point: the audience that reaches external pages. The screenshots do not allow us to measure sales or assign an economic value to each attendee.
Furthermore, "actual traffic" does not mean that the figures from an external tool are audited records from the site. Here we are talking about visits or users attributed to these platforms according to each source.
Overall ranking: Which AI generates the most visits to other websites?
The SE Ranking study, published in June 2026, places ChatGPT in first position, followed by Gemini, Perplexity, Copilot, and Claude. Its analysis uses aggregated and anonymized data from 101,574 websites across 250 countries and territories, tracked between January 2025 and April 2026.
These are the odds it presents for 2026:
| Assistant | Share of AI-referred traffic |
|---|---|
| ChatGPT | 74,78% |
| Gemini | 11,56% |
| Perplexity | 7,23% |
| Microsoft Copilot | 3,51% |
| Claude | 2,62% |
The difference is considerable: ChatGPT accounts for nearly three-quarters of the channel. But this leadership coexists with a still relatively small share of the total audience for AI. In the same study, these platforms represent only 0.32% of the traffic to the websites analyzed.
Why do other studies offer different percentages?
BrightEdge presents a different distribution for August 2026: it attributes 95.1% of AI referrals to ChatGPT, compared to 2.4% for Gemini, 1.1% for Perplexity and 0.8% for Claude.
We shouldn't combine these figures with the previous ones to construct a supposed universal quota. They are analyses from different providers and with different time periods.
What both agree on is ChatGPT's leadership within their respective metrics. What they don't establish is a percentage that must be replicated on every website.
Europe and the United States do not have an identical distribution either.
An update to the SE Ranking published in July, which incorporates data up to May 2026, places ChatGPT's share of AI traffic in 2026 at 76.77% for the European Union and 72.41% for the United States. The United Kingdom appears separately, with 86.27%.
These figures illustrate why analyzing the target market is crucial. A website aimed at American readers will not necessarily receive the same number of visitors as one targeting Spain, France, or the United Kingdom.
Practical example with lOOkkle: howtogeek.com
At lOOkkle we have opted for the analysis, on this occasion, of a leading website in the technology sector, and how for this sector the traffic received from AI platforms can be measured.
As an initial example, howtogeek.com received 3,321,763 visits in September 2026. This sample also includes indicators of organic, social, referral, and artificial intelligence traffic.
Organic traffic comes from unpaid search engine results. Referral traffic comes from links on other websites.
| Indicator | Value shown in lOOkkle |
|---|---|
| Visits of the month | 3.321.763 |
| Organic | 1.428.358 |
| Referral | 265.741 |
| Social | 132.871 |
| AI trafficking | 42.253 |
| New users | 2.185.720 |
These values are presented as lOOkkle information, not as records from internal domain analytics.
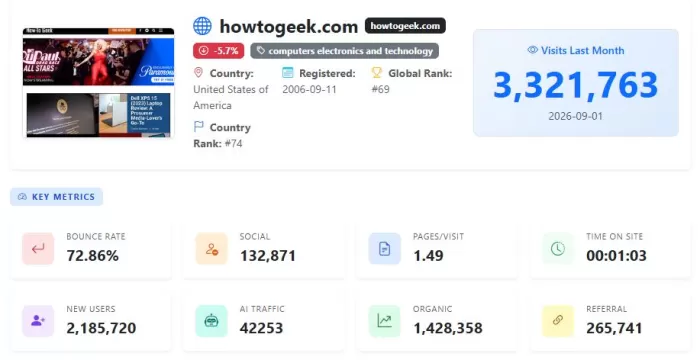
The initial comparison is useful: the organic indicator has a much higher volume than the AI indicator. However, before calculating proportions, we must check which unit each card uses.
The important detail: users and visits are not the same thing
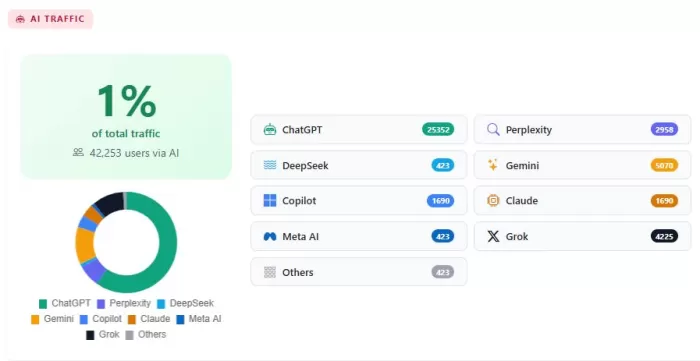
The AI-specific card shows “42,253 users via AI” and “1% of total traffic.” The main card uses “Visits Last Month” for the 3,321,763 visits.
A user can make multiple visits. Therefore, we shouldn't divide both amounts and present the result as a perfectly comparable fee.
AI ranking on howtogeek.com: ChatGPT first, Gemini second
lOOkkle's breakdown allows you to compare the users attributed to each assistant. ChatGPT ranks first, followed by Gemini and Grok. Perplexity comes in fourth; Copilot and Claude are tied for second place.
| Position | Platform | Users shown | Approximate share of total AI |
|---|---|---|---|
| 1 | ChatGPT | 25.352 | 60% |
| 2 | Gemini | 5.070 | 12% |
| 3 | Grok | 4.225 | 10% |
| 4 | Perplexity | 2.958 | 7% |
| 5 | Copilot | 1.690 | 4% |
| 5 | Claude | 1.690 | 4% |
| 7 | DeepSeek | 423 | 1% |
| 7 | Meta AI | 423 | 1% |
| 7 | Others | 423 | 1% |
Source: AI breakdown screenshot. Shares have been rounded off from the total of 42,253 users shown. Individual values add up to 42,254: there is a one-unit difference that the image does not explain.
ChatGPT contributes the majority of the volume
The 25,352 users attributed to ChatGPT represent approximately six out of every ten AI users. Its volume is about 8.6 times that of Perplexity and about 15 times that of Claude.
This difference is significant enough to identify it as the primary AI audience provider in this case. However, it doesn't, on its own, prove that its visits convert better.
Gemini and Grok change the order of the comparison
Gemini appears with 5,070 users and Grok with 4,225. Both surpass Perplexity's 2,958.
This result highlights the importance of limiting the analysis to ChatGPT, Claude, and Perplexity, as this can overlook important sources. To study a specific website, it's advisable to examine all available platforms, not just those most frequently mentioned in SEO discussions.
Perplexity and Claude: lower volume, quality yet to be measured
Perplexity represents approximately 7% and Claude 4% of the AI traffic shown.
The images do not include conversions, reading time, or bounce rate per assistant. Therefore, they do not allow us to claim that a site brings in more loyal readers, more interested buyers, or less valuable visits.
The distinction is important: the volume ranking is not necessarily the profitability ranking.
How does this domain compare to general studies?
On howtogeek.com, ChatGPT scores approximately 60%, compared to 74.78% in the SE Ranking sample for 2026. Gemini and Perplexity have percentages close to those in that study, while Grok has a prominent presence in the particular panel.
These differences alone do not demonstrate a contradiction. We compared a domain with an international sample, and a tool with an analysis based on aggregated Google Analytics data.
The useful conclusion is that general data serves as a reference; specific analysis shows how that channel is distributed on a specific website.
How AI traffic is evolving on howtogeek.com
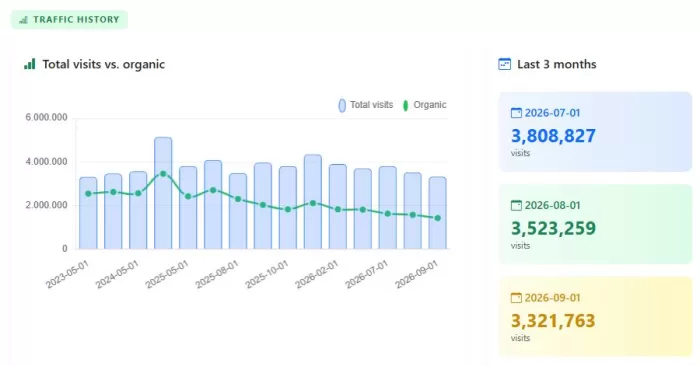
The historical data included in the lOOkkle results allows us to observe something: the weight of AI traffic can increase while total visits decrease.
Between July and September 2026, monthly visits to howtogeek.com dropped from 3,808,827 to 3,321,763. During that same period, the percentage identified as AI increased from 1.16% to 1.27%.
| Month of 2026 | Total visits | Percentage of AI indicated in the historical data |
|---|---|---|
| July | 3.808.827 | 1,16% |
| August | 3.523.259 | 1,25% |
| September | 3.321.763 | 1,27% |
Source: General and AI historical data included in the lOOkkle analysis.
The September data provides important clarification: the summary card shows 1%, while the historical data shows 1.27%. Therefore, to describe the monthly trend, it is more informative to use the historical percentages, indicating their source.
Gaining weight does not mean receiving more users
A share can increase even if the channel's volume decreases. This is what happened with the figures for the main attendees during these three months:
| Assistant | July 2026 | August 2026 | September 2026 |
|---|---|---|---|
| ChatGPT | 26.621 | 26.343 | 25.352 |
| Gemini | 5.324 | 5.268 | 5.070 |
| Grok | 4.437 | 4.390 | 4.225 |
| Perplexity | 3.106 | 3.074 | 2.958 |
| Claude | 1.775 | 1.756 | 1.690 |
| Copilot | 1.775 | 1.756 | 1.690 |
Source: lOOkkle's historical AI breakdown.
ChatGPT remains in first place, but its September figures are lower than its July figures. The same is true for the other attendees on the list.
The difference between volume and percentage is fundamental for any website owner: a channel may represent a larger part of the audience simply because the site as a whole has declined more.
What role does organic traffic play?
Organic traffic, visits from unpaid search results, also declined during the quarter. lOOkkle shows 1,630,940 in July, 1,577,363 in August, and 1,428,358 in September.
| Month of 2026 | Organic traffic shown |
|---|---|
| July | 1.630.940 |
| August | 1.577.363 |
| September | 1.428.358 |
Source: lOOkkle traffic history.
The search engine breakdown attributes 92% of the displayed search traffic to Google, followed by Bing with 4% and DuckDuckGo with 2%.
This puts the AI ranking into context: identifying ChatGPT as the leader in attendees doesn't imply it's the primary audience source for howtogeek.com. The dashboard continues to show a significantly higher organic volume than the AI indicator.
However, the drop in organic traffic does not prove that attendees have absorbed those visits.
The United States concentrates the audience
The United States accounts for 62.55% of the distribution shown, followed by the United Kingdom and Canada.
| Country | Percentage shown |
|---|---|
| USA | 62,55% |
| United Kingdom | 4,47% |
| Canada | 4,44% |
| India | 2,43% |
| Australia | 2,12% |
Source: lOOkkle countries section.
This profile helps contextualize the case for businesses and publishers working with a US audience. However, it does not make howtogeek.com representative of all US websites.
How to leverage this analysis on a small website
You don't need millions of visits to apply the same logic. What's important is comparing consistent data and relating it to your objectives.
1. Record volume and percentage separately
Note how many users or sessions each attendee contributes and what weight this represents on a comparable basis.
The case of howtogeek.com shows why you need both indicators: the percentage of AI increases between July and September, but the figures for the main assistants decrease.
2. Compare complete periods
Use full months and stick to the same source. Avoid comparing a current card with historical data from another tool without verifying their definitions.
3. Check which pages the audience is landing on.
In your own analytics, check if these visits land on tutorials, comparisons, product pages, or service pages. This will allow you to identify which content is attracting an audience from attendees.
4. Measure the outcome that matters to your business
For a store it might be a purchase; for a blog, a subscription; for an affiliate website, a click towards an offer.
The lOOkkle figures analyzed here allow us to compare the volume attributed to each AI, but not to determine which one generates more revenue.
5. Review the differences before publishing conclusions
If two sections show different values, check the period, unit, and definition of the indicator. If you cannot resolve the difference, state it and avoid calculations that depend on it.
Conclusion: ChatGPT leads the panel
In the breakdown on howtogeek.com, lOOkkle attributes 25,352 users to ChatGPT, roughly 60% of the total AI displayed. Gemini appears next, followed by Grok, Perplexity, and a tie between Claude and Copilot.
The historical data adds an important nuance: the percentage of AI (Audience Influence) rises from 1.16% in July to 1.27% in September 2026, although the figures for the main attendees decline during that period. Gaining relative presence does not necessarily equate to gaining audience.
For a publisher or small business, the priority should be consistent measurement: distinguishing users from website visitors, comparing equivalent time periods, and verifying the results each source produces. Rankings help identify who contributes the most volume; in-house analytics reveal which audience provides the most value.