Reading Time 3
Number of Words 664
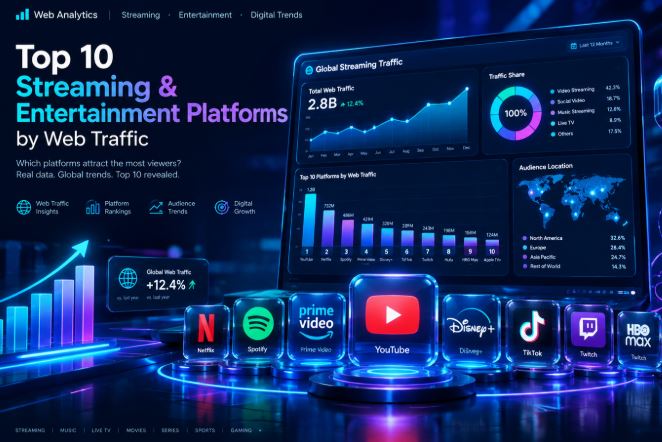
Digital content consumption is going through a consolidation phase where video on demand, live broadcasts and community platforms concentrate massive shares of global attention.
Based on the metrics data analyzed by Lookkle, we break down which are the ten streaming and entertainment services that dominate the volume of monthly visits internationally.
Overview of digital traffic
The digital entertainment sector exhibits a very marked concentration at the top. While global giants operate with hundreds or billions of monthly visits, specialized services or subscription television providers complement the offering with highly loyal niche audiences.
The audited data reflects three key trends:
-
Absolute hegemony of open video: The combination of user-generated content alongside official productions continues to far surpass any closed monthly subscription model.
-
Fusion between entertainment and community: Platforms that combine streaming with forums, creator profiles or collaborative encyclopedias register a retention time and recurrence much higher than passive catalogs.
-
Resilience of the subscription model: Despite the fragmentation of offerings, brands like Netflix and Disney+ maintain a leading position in capturing direct web traffic.
Ranking of the 10 leading platforms
The following table summarizes the ten domains with the highest traffic volume within the streaming, video on demand, and general entertainment categories audited by Lookkle:
| Position | Platform / Domain | Estimated Monthly Visits | Main Content Model | Country with the Highest Traffic Share |
|---|---|---|---|---|
| 1 | youtube.com |
13,582,366,455 | Video on demand and live streams | United States (21.36%) |
| 2 | netflix.com |
819.197.370 | Movies and TV series by subscription | United States (18.84%) |
| 3 | twitch.tv |
445.103.555 | Live streams, video games and events | United States (19.45%) |
| 4 | fandom.com |
398,613,400 | Community, wikis and pop culture | United States (38.12%) |
| 5 | imdb.com |
247,889,073 | Database of movies, trailers and TV | United States (29.54%) |
| 6 | spotify.com |
218.176.531 | Music streaming and podcasts | United States (18.10%) |
| 7 | disneyplus.com |
152,839,104 | Family catalog and franchises | United States (22.95%) |
| 8 | archiveofourown.org |
132.002.908 | Community fiction and literature | United States (31.40%) |
| 9 | soundcloud.com |
58,238,460 | Independent music and audio streaming | United States (18.75%) |
| 10 | deviantart.com |
47,484,512 | Digital art and visual entertainment | United States (18.22%) |
Analysis of the ranking's key players
1. YouTube: The unattainable benchmark
With over 13.58 billion monthly visits, Google's platform operates on a scale of its own. It simultaneously functions as a music player, educational channel, social network, and live streaming provider, capturing more than a fifth of its direct traffic from the United States, followed by major markets such as India, Japan, and Brazil.
2. Netflix: The standard of paid streaming
Reaching nearly 820 million monthly subscribers, Netflix has solidified its position as the preferred choice among fixed-line subscription services. Its global catalog and strategy of regular releases ensure a steady stream of traffic without relying on broadcast television.
3. Twitch: The epicenter of live streaming
With over 445 million views, Amazon's subsidiary demonstrates that live streaming has transcended video games themselves. It now competes head-to-head with linear television in special coverage, talks, and real-time entertainment events.
4. Fandom and IMDb: The pillars of audiovisual consultation
With a combined total of over 646 million visits, these websites demonstrate the importance of the ecosystem surrounding productions. Viewers don't just watch a series or film: they regularly visit these sites to check technical specifications, plot summaries, and community theories.
5. Spotify and SoundCloud: Audio in the retention battle
The presence of Spotify's (more than 218 million) and SoundCloud's (more than 58 million) web portals demonstrates that music streaming maintains a relevant flow of interaction from desktop and laptop browsers, beyond their native mobile applications.
Geographical distribution of consumption
According to the breakdown of origins recorded by Lookkle, the United States continues to position itself as the number one source market on all major platforms, typically contributing between 18% and 38% of total traffic.
However, countries with a rapidly expanding internet user base such as India, Brazil, Japan, and the United Kingdom consistently occupy the next rungs of traffic, consolidating a markedly international audience for any web entertainment format.
Methodology and origin of the data
The measurements presented have been extracted from Lookkle's traffic monitoring log, corresponding to the recent history audited by its web analytics and tracking algorithms.