Reading Time 3
Number of Words 604
In the online ecosystem, success is usually measured by the volume of visits a portal receives, but the determining metric for understanding the business on the internet is the attention span of the users.
The analytical data extracted from Lookkle reflects two very different models of leadership on the network: Google 's unattainable scale as a global gateway versus X 's retention capacity , which leads in average session time.
Google: the colossal scale of the global search engine
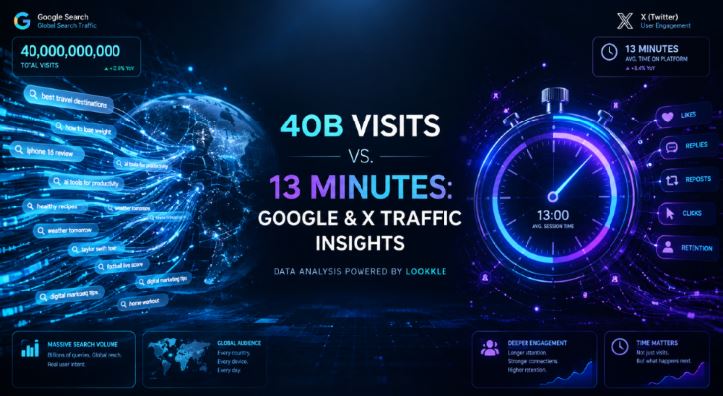
Traffic records monitored by Lookkle place Google in the undisputed first position on the internet with over 40.166 billion monthly visits . Its model is based on quickly resolving users' search intent and distributing that traffic to other websites.
-
Visit volume: 40,166,621,171 visits in the last closed month recorded on Lookkle.
-
Navigation depth: 8.63 pages explored per session.
-
Average time on site: 9 minutes and 58 seconds.
-
Bounce rate: 33.40%, a remarkably low figure considering that millions of queries are resolved in a few seconds.
These values demonstrate that internet users do not limit themselves to a single search, but rather chain together consecutive queries, browse through thematic tabs, and use the multiple integrated services of the search engine.
X: the absolute record for retention and screen time
In the social and real-time debate sphere, Lookkle's metrics show that X (formerly Twitter) accumulates 1.971 billion monthly visits and is crowned as the platform with the highest average stay time in the entire technology ranking, registering 13 minutes and 24 seconds per user .
In addition to their screen time, X visitors explore an average of 14.85 pages per visit , easily surpassing community-format competitors like Reddit (which registers 4.78 pages and 5 minutes and 37 seconds spent on the site). The rapid consumption of breaking news, conversation threads, and interactive multimedia format explain this browsing loyalty.
Comparison of traffic and retention in Lookkle
Lookkle's database allows for comparison of user behavior on major technology portals, highlighting how browsing habits change depending on the type of service:
| Platform | Category in Lookkle | Monthly Visits | Average Time on Site | Pages / Visit | Rebound Rate |
|---|---|---|---|---|---|
| google.com | Search engines | 40.166.621.171 | 09:58 | 8,63 | 33,40% |
| x.com | Social networks and communities | 1.971.759.722 | 13:24 | 14,85 | 36,40% |
| facebook.com | Social networks and communities | 5.161.725.637 | 10:13 | 12,33 | 35,11% |
| instagram.com | Social networks and communities | 3.439.300.172 | 08:36 | 12,40 | 38,37% |
| reddit.com | Social networks and communities | 1.804.883.454 | 05:37 | 4,78 | 48,11% |
| linkedin.com | Professional networks | 966.093.605 | 07:01 | 8,95 | 26,95% |
| github.com | Software and development | 304.465.338 | 06:25 | 5,64 | 41,44% |
The contrast with functional tools
Lookkle's analytics also highlight behavior on readily available utility tools. Network testing portals like Fast.com register 37.6 million monthly visits, but have a bounce rate of 76.43% and an average session duration of just 1 minute and 31 seconds . In this case, the user enters with a single objective: to check their connection speed and close the tab immediately.
In the middle ground are software platforms like GitHub , which, with 304 million visits, keeps developers engaged for more than 6 minutes and 25 seconds, confirming that code review and documentation require extended work sessions.
Conclusions and digital intelligence with Lookkle
The data collected by Lookkle confirms that analyzing web performance requires looking beyond the simple visitor counter:
-
The massive volume (Google's territory) generates the largest search and distribution inventory on the planet.
-
The high permanence and depth (the terrain of X) turns the platforms into centers of continuous attention, multiplying the impacts for each session.
Thanks to Lookkle 's visualization and analysis tools , editors, SEO consultants, and digital professionals can audit the real performance of any website, detect niches with high retention, and understand the browsing trends that drive the internet.