Reading Time 7
Number of Words 1519
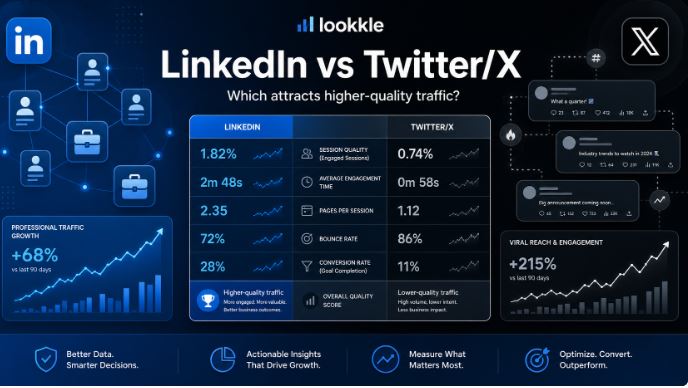
Do you know how many visitors leave your competitor's website without doing anything?
This data, known as bounce rate, can reveal more about their strategy than any other number.
In this guide we explain what it means, how to interpret it and how to consult it for free with Lookkle.
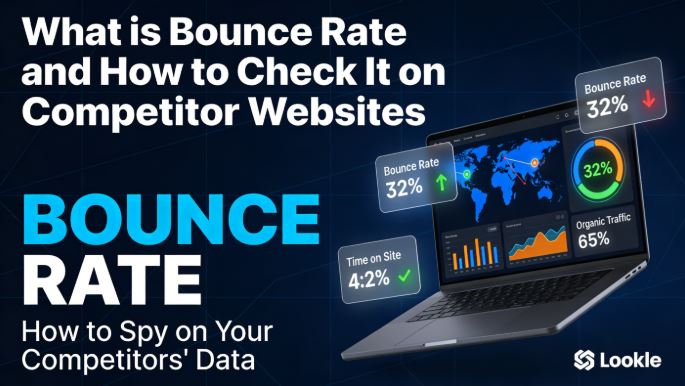
What is the Rebound Rate?
The bounce rate is the percentage of visitors who arrive at a website and leave without taking any action: without clicking, navigating to another section, or filling out a form. In other words, they enter and leave without interacting .
It is expressed as a percentage and is calculated with a simple formula:
Bounce Rate = (Single-page sessions / Total sessions) × 100
For example, if 1,000 people visit a website and 550 leave without doing anything, the bounce rate is 55%.
Why is it important for SEO?
The bounce rate is an indicator of content quality and user experience (UX). Google uses it as an indirect signal to assess whether a page satisfies the user's search intent. A high bounce rate can indicate:
-
🐌 The page loads too slowly
-
❌ The content does not meet the user's search criteria.
-
📱 The design is not responsive or is confusing on mobile
-
🎯 The traffic captured is not suitable for the page
-
🔗 Lack of calls to action or internal links
A low bounce rate, on the other hand, indicates that users find what they are looking for and continue exploring the site, which improves organic ranking.
What is a good bounce rate?
There is no universal magic number: it depends on the type of website and the sector. However, these are the most widely accepted reference ranges:
| 🌐 Website Type | 📊 Average Bounce Rate |
|---|---|
| E-commerce / Online stores | 20% – 45% |
| Corporate B2B websites | 25% – 55% |
| Blogs and content media | 65% – 90% |
| Landing pages / Sales pages | 60% – 90% |
| Portals and directories | 65% – 90% |
| Lead generation websites | 30% – 55% |
And depending on the traffic source, the averages also vary:
| 📡 Traffic Source | 📉 Average Bounce Rate |
|---|---|
| Organic traffic (Google) | 43,6% |
| Paid traffic (Ads) | 44,1% |
| Direct traffic | 49,9% |
| Email marketing | 35,2% |
| Social networks | 54% |
| Trafficking mentioned | 37,5% |
💡 General rule: Below 40% is excellent, between 40-55% is acceptable, and above 70% it is advisable to investigate what is failing.
Bounce Rate in GA4 vs. Universal Analytics
With the arrival of Google Analytics 4 (GA4), the bounce rate definition changed. In Universal Analytics, a bounce was any single-page session. In GA4, the concept of an "interactive session" was introduced : if a user remains on the page for more than 10 seconds, even without clicking, it is no longer counted as a bounce.
Therefore, in GA4 you will see two complementary metrics:
-
Bounce rate: sessions with no interaction
-
Interaction rate: opposite percentage, sessions where there was engagement
This means that bounce rates in GA4 are typically lower than those in the old Analytics, and are not directly comparable.
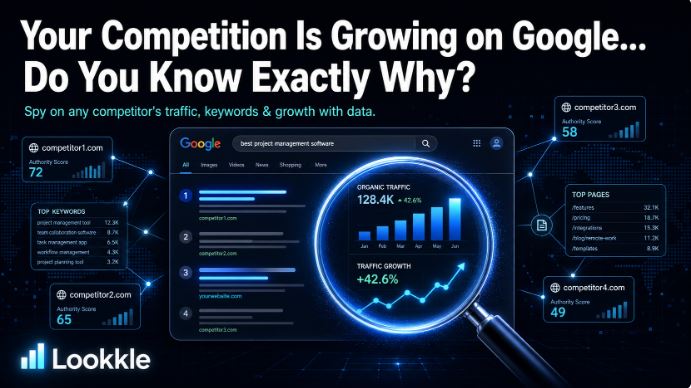
How to View the Bounce Rate of Competitor Websites
Here's the most valuable piece of information: you can check the estimated bounce rate of any website, not just your own. Tools like Lookkle allow you to analyze user behavior on competitor sites for free and without registration.
🔎 Steps to View It on Lookkle
-
Accede a lookkle.com
-
Go to the competitor analysis section or Website Competitor Analysis
-
Enter the URL of the site you want to analyze (your competitor's or your own)
-
In seconds you'll get a dashboard with: bounce rate, average time on site, pages per session, traffic sources, countries, and more
-
You need to create a free account for basic analysis
📊 What Data Does Lookkle Show Along With the Bounce Rate?
Lookkle doesn't just show you a percentage: it offers a complete context to properly interpret the data. Here are the most basic data points within other information:
| 📋 Metrics | 💡 What it reveals |
|---|---|
| Bounce rate | If the content is engaging, or if users leave quickly |
| Average time on site | How much time on average do users spend |
| Pages per session | If users explore beyond the homepage |
| Trafficking by country | Which geographic markets does your competitor dominate? |
| Traffic sources | Whether it comes from Google, social media, direct message, or email |
| New vs. returning users | Level of audience loyalty |
| Similar competitor sites | Websites with a similar traffic profile |
How to Interpret Your Competitor's Bounce Rate
Seeing the number is easy. Knowing what to do with it is what makes the difference. Here are the most common scenarios:
🔴 Competitor with a HIGH bounce rate (+65%)
This means your content isn't satisfying users or is attracting unqualified traffic. This is your opportunity to:
-
Create more comprehensive and better structured content on the same topics
-
Improve your UX to clearly differentiate yourself
-
Attract the users he is losing
🟢 Competitor with a LOW bounce rate (-35%)
Its content engages and retains visitors. Analyze:
-
How you structure your articles (length, images, videos, FAQs)
-
If you use embedded videos or interactive elements
-
Its design and loading speed
-
The internal links it uses to guide navigation
🟡 Mid-range competitor (40-55%)
It's a typical profile. The difference will be made by other factors such as total traffic, time spent on the site, and sources of visits.
Practical Example: Real Analysis with Lookkle
Imagine you have a tech blog and you analyze your main competitor with Lookkle. The dashboard shows you:
-
Bounce rate: 32% (yours is 61%)
-
Time on site: 4 minutes 20 seconds
-
Pages per session: 3.8
-
Organic traffic: 65% of the total
-
Main countries: Spain, Mexico, Argentina
With this information you can conclude that:
-
Their content retains users much longer — check out how they structure their articles
-
It has a very solid SEO with almost 2/3 of its traffic coming from Google.
-
It's dominating Latin America — a market you might not be covering well.
-
Users visit almost 4 pages per session — use lots of internal links or related content
All this information allows you to draw up a concrete action plan, based on real data, not assumptions.
Factors that Affect the Rebound Rate
Understanding the causes helps you both to improve your own and to identify weaknesses in your competitors':
-
⚡ Loading speed: Every extra second of loading increases the bounce rate by up to 32%
-
📱 Mobile design: Over 60% of traffic comes from mobile — a website that isn't mobile-friendly will increase bounce rates.
-
🎯 Consistency with the ad or search result: If the user arrives expecting something different, they will leave
-
📖 Content quality: Superficial, unstructured, or outdated texts increase abandonment rates
-
🔗 Lack of internal links: Without clear paths, the user has no reason to stay.
-
💬 Lack of CTA: Without clear calls to action, the user doesn't know what to do next.
-
🎨 Confusing visual design: A chaotic design or one with excessive advertising leads to immediate abandonment.
How to Reduce Your Own Bounce Rate
Once you have analyzed your situation and that of your competition, apply these strategies:
-
Improve loading speed with tools like PageSpeed Insights and by compressing images
-
Add videos or infographics at the beginning of the content to grab attention in the first few seconds.
-
Use a clear structure with H2, H3, lists, and tables to facilitate visual scanning.
-
Include relevant internal links in each article to guide the user to more content.
-
Write a powerful introduction that confirms to the user that they have arrived at the right site
-
Add a related articles section at the end of each post
-
Optimize for mobile — test your website on different devices regularly
-
Review traffic by source — social media traffic naturally has higher bounce rates
Lookkle vs. Other Tools for Viewing Bounce Rate
| 🛠️ Tool | 💰 Price | 📊 Competition Bounce Rate | 🔑 Registration |
|---|---|---|---|
| Lookkle | Free | ✅ Yes | ✅ Yes |
| SimilarWeb | Freemium (limited) | ✅ Yes (Pro version) | ✅ Yes |
| SEMrush | Paid (~$120/month) | ✅ Yes | ✅ Yes |
| Ahrefs | Paid ($~$99/month) | ⚠️ Partial | ✅ Yes |
| Google Analytics | Free | ❌ Only you web | ✅ Yes |
| Ralfvanveen Estimator | Free | ⚠️ Basic estimate | ❌ No |
💡 Lookkle Advantage: It's the most accessible option for analyzing competitors' bounce rates without paying, with a data dashboard that includes multiple behavioral metrics in a single query.
❓ Frequently Asked Questions about Bounce Rate
❓ Does bounce rate directly affect Google ranking?
Google has never officially confirmed that it uses bounce rate as a direct ranking factor, but it does have an indirect influence: a high rate indicates a poor user experience, which does penalize ranking.
❓ Can I see my own website's bounce rate for free?
Yes, with Google Analytics (free) you have full access to your own bounce rate. To see the bounce rate of external websites, you need tools like Lookkle.
❓ Is an 80% bounce rate always bad?
Not necessarily. On blogs, news sites, or contact pages, high bounce rates are normal because users get what they're looking for in a single page. It depends on the page's purpose.
❓ How often should I check my competitors' bounce rate?
Ideally, you should analyze it monthly to detect trends. If a competitor's bounce rate drops drastically, something is changing in their content strategy or UX.
❓ Is Lookkle reliable for this data?
Lookkle, like SimilarWeb, offers estimates based on its own data panels and algorithms. The data isn't as precise as Google Analytics, but it's accurate enough for making strategic decisions and comparing trends.
Conclusion
Bounce rate is much more than a number: it's a window into real user behavior and the quality of any website's content. Knowing yours is important; knowing your competitors' is a real competitive advantage.
With tools like Lookkle you can access this data for free, without registration and in a matter of seconds, combining it with other metrics such as time on site, traffic sources or countries of origin to build a complete analysis.
Start today: analyze the bounce rate of your three main competitors, compare it to yours, and you'll have an improvement plan based on real data, not intuition.