Reading Time 9
Number of Words 1855
How much time does a user actually spend on their favorite website or on any website?
Time spent on a website is one of the most revealing indicators of online behavior: it measures the value that users find in it.
We used Lookkle's Web Traffic Checker tool to analyze traffic data from the world's leading websites to answer this question with real data, updated to February 2026.
🔍 What is Time on Site and Why Does It Matter?
Time on site ( or session duration ) measures how many minutes and seconds a user spends browsing a website from the moment they enter until they leave. It is a different metric from time spent on individual pages: time on site encompasses the entire session, including all the pages visited.
In 2025-2026, the global average time on site for most websites is just 2 minutes and 17 seconds.
The sites that far exceed that average have something very special: engaging content, active communities, or services that create a dependency on use. All 50 sites in this ranking do these things, and by a wide margin.
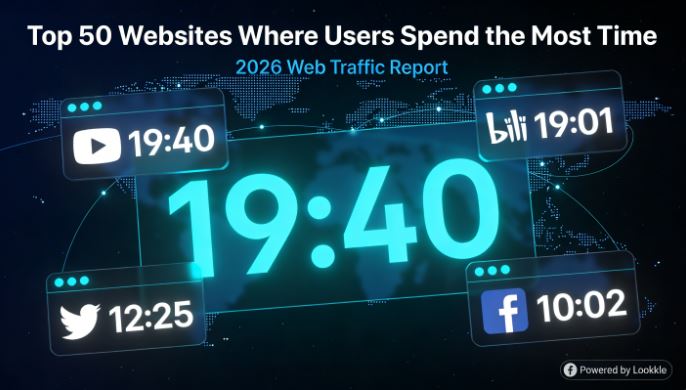
🏆 The Complete Ranking: Top 50 by Time on Site
Data obtained using Lookkle's Web Traffic Checker tool. Ordered from longest to shortest time on site .
| # | Place | ⏱️ Time on site | 📄 Pages/visit | 📊 Bounce Rate | 🌍 Monthly traffic |
|---|---|---|---|---|---|
| 🥇1 | youtube.com | 00:19:40 | 12 | 37.64% | 15.186.872.463 |
| 🥈2 | bilibili.com | 00:19:01 | 13 | 30.71% | 642.812.088 |
| 🥉3 | naver.com | 00:12:55 | 12 | 41.15% | 809.005.710 |
| 4 | x.com | 00:12:25 | 14 | 46.65% | 2.270.793.722 |
| 5 | instructure.com | 00:11:00 | 8 | 30.80% | 193.536.133 |
| 6 | telegram.org | 00:10:48 | 13 | 40.04% | 245.576.328 |
| 7 | discord.com | 00:10:42 | 9 | 48.86% | 309.579.180 |
| 8 | office.com | 00:10:29 | 8 | 41.14% | 644.084.877 |
| 9 | google.com | 00:10:08 | 8 | 43.36% | 42.878.287.308 |
| 10 | facebook.com | 00:10:02 | 12 | 45.53% | 6.027.610.895 |
| 11 | ozon.ru | 00:09:48 | 12 | 40.23% | 272.580.010 |
| 12 | whatsapp.com | 00:08:59 | 3 | 77.88% | 1.768.270.640 |
| 13 | roblox.com | 00:08:37 | 7 | 40.19% | 310.741.395 |
| 14 | yahoo.co.jp | 00:08:34 | 7 | 48.27% | 1.515.319.821 |
| 15 | instagram.com | 00:08:15 | 12 | 48.39% | 3.538.512.871 |
| 16 | vk.com | 00:08:13 | 11 | 47.59% | 453.829.780 |
| 17 | bing.com | 00:07:57 | 6 | 46.33% | 1.729.059.024 |
| 18 | yandex.ru | 00:07:57 | 8 | 41.80% | 1.432.322.383 |
| 19 | dzen.ru | 00:07:57 | 5 | 49.58% | 689.804.714 |
| 20 | indeed.com | 00:07:48 | 10 | 44.46% | 208.212.878 |
| 21 | disneyplus.com | 00:07:46 | 4 | 54.66% | 188.721.136 |
| 22 | booking.com | 00:07:37 | 8 | 41.50% | 298.176.343 |
| 23 | twitch.tv | 00:07:23 | 4 | 46.59% | 530.389.881 |
| 24 | linkedin.com | 00:07:23 | 8 | 37.79% | 952.717.372 |
| 25 | rutube.ru | 00:07:19 | 4 | 63.91% | 189.967.256 |
| 26 | duckduckgo.com | 00:07:17 | 6 | 28.75% | 365.174.140 |
| 27 | pinterest.com | 00:07:10 | 8 | 50.64% | 742.582.870 |
| 28 | amazon.co.jp | 00:06:49 | 8 | 51.24% | 264.961.518 |
| 29 | yahoo.com | 00:06:23 | 5 | 52.77% | 1.429.564.993 |
| 30 | live.com | 00:06:22 | 7 | 36.86% | 733.711.415 |
| 31 | chatgpt.com | 00:06:22 | 4 | 47.26% | 2.861.843.190 |
| 32 | github.com | 00:06:21 | 6 | 51.08% | 271.303.474 |
| 33 | ebay.com | 00:06:18 | 7 | 53.86% | 333.043.545 |
| 34 | msn.com | 00:06:15 | 5 | 57.70% | 253.923.692 |
| 35 | uol.com.br | 00:06:13 | 4 | 63.98% | 124.309.468 |
| 36 | mail.ru | 00:06:10 | 8 | 52.16% | 387.543.418 |
| 37 | canva.com | 00:06:00 | 6 | 41.57% | 438.039.249 |
| 38 | amazon.com | 00:05:59 | 9 | 45.80% | 1.359.615.143 |
| 39 | amazon.de | 00:05:57 | 9 | 46.59% | 216.994.832 |
| 40 | netflix.com | 00:05:44 | 4 | 55.24% | 868.349.213 |
| 41 | spotify.com | 00:05:32 | 5 | 58.07% | 282.819.877 |
| 42 | marca.com | 00:05:21 | 3 | 57.38% | 111.675.738 |
| 43 | amazon.co.uk | 00:05:15 | 7 | 48.08% | 191.326.863 |
| 44 | cricbuzz.com | 00:05:13 | 2 | 57.20% | 167.022.258 |
| 45 | tiktok.com | 00:04:55 | 9 | 57.79% | 1.595.350.960 |
| 46 | fandom.com | 00:04:45 | 4 | 63.91% | 463.641.503 |
| 47 | etsy.com | 00:04:43 | 6 | 54.63% | 229.743.269 |
| 48 | walmart.com | 00:04:19 | 4 | 65.18% | 250.219.011 |
| 49 | aliexpress.com | 00:04:12 | 4 | 58.50% | 316.536.684 |
| 50 | temu.com | 00:04:11 | 5 | 61.50% | 765.721.733 |
🎬 The Podium: YouTube, Bilibili and Naver
🥇 YouTube — 19 minutes and 40 seconds
YouTube is not only the king of online video: it is the website where users spend the most time per session on the entire list, with an average of almost 20 minutes.
With over 15.1 billion monthly visits, it combines stratospheric traffic volume with extraordinary engagement.
Its bounce rate of 37.64%—very low for a site of its scale—confirms that users don't arrive by mistake: they come to stay. Autoplay, playlists, and the recommendation algorithm are the driving force behind that.
🥈 Bilibili — 19 minutes and 1 second
Bilibili is the great unknown in this ranking for Western audiences, but the data speaks for itself. This Chinese video and entertainment portal—often referred to as the "YouTube of China"—registers an average session time of 19 minutes and has the lowest bounce rate in the entire ranking: 30.71%. Its users are incredibly loyal: in 2025, Bilibili reported that the average daily time per user reached an all-time high of 108 minutes. With 368 million monthly active users, it's an engagement powerhouse that the Western world tends to overlook.
🥉 Naver — 12 minutes and 55 seconds
Naver, the dominant portal and search engine in South Korea, appears in third position with an average session time of almost 13 minutes and 12 page views per visit. It is a multi-functional portal that integrates search, news, blogs, webtoons, maps, and messaging services into a single platform—which explains why users stay for so long.
📊 Analysis by Categories
🎥 Video and Streaming Platforms
Video platforms dominate the top of the ranking, a completely logical pattern: video is the format that consumes the most time by nature.
-
YouTube (19:40) and Bilibili (19:01) lead by a wide margin
-
Twitch (7:23) is positioned well with live streaming
-
Netflix (5:44) surprises with a relatively low time for a video platform — users arrive, log in and go directly to the app, they don't browse the web
-
Disney+ (7:46) surpasses Netflix in web time for the same reason: more catalog browsing from the browser.
-
TikTok (4:55) appears in position 45 — its users consume the platform mainly from the mobile app, not from the web.
📱 Social Networks
Social networks exhibit very different behaviors from one another:
-
X.com / Twitter (12:25) leads social networks in session time, thanks to its infinite feed and discussion threads that generate prolonged reading
-
Facebook (10:02) maintains an average of 10 minutes despite its maturity as a platform
-
Instagram (8:15) with 12 pages per visit shows that scrolling is intense even though sessions are somewhat shorter
-
Telegram (10:48) surprises in the top 10 — its content channels and active groups generate long sessions
-
Discord (10:42) confirms that gaming and technology communities are extremely retainers
🛒 E-commerce
Amazon appears in four geographical variations of the ranking:
| Domain | Time on site | Pages/visit |
|---|---|---|
| amazon.co.jp | 6:49 | 8 |
| amazon.com | 5:59 | 9 |
| amazon.de | 5:57 | 9 |
| amazon.co.uk | 5:15 | 7 |
Amazon Japan leads with almost 7 minutes and its users visiting 8 pages — reflecting a more exploratory purchasing behavior. eBay (6:18) and Etsy (4:43) complete the picture of generalist e-commerce, while Temu (4:11) and AliExpress (4:12) are at the bottom of the ranking, with short times and high bounce rates suggesting quick transactional visits.
🤖 Artificial Intelligence
ChatGPT.com 's debut in the ranking with an average time of 6 minutes 22 seconds is one of the most revealing pieces of data from 2026.
With nearly 2.9 billion monthly visits, ChatGPT has gone from being a technological novelty to a work tool integrated into the daily workflow of millions of users.
Its bounce rate of 47.26% indicates that almost half of the visits are quick, single-session inquiries, but the other half generate prolonged work sessions.
🔍 Search Engines
Search engine behavior is paradoxical: its stated goal is to lead the user to another website, but the data shows something different:
-
Google (10:08, 8 pages/visit) — users perform multiple searches per session before finding what they are looking for
-
Bing (7:57) — perfil similar a Google
-
Yandex (7:57) — the Russian search engine integrates news and services that increase time
-
DuckDuckGo (7:17) with the lowest bounce rate among search engines: 28.75% — users who choose DuckDuckGo for privacy are more engaged
🔑 Patterns and Conclusions of the Analysis
More pages = more time, but with exceptions.
There is a correlation between pages per visit and time on site, but there are notable exceptions:
-
X.com leads in pages per visit ( 14 pages ) with a time of 12:25
-
WhatsApp.com only has 3 pages per visit but almost 9 minutes — users open WhatsApp Web and stay on the same tab for the entire session
-
Instructure.com (Canvas LMS) has 8 pages but 11 minutes — students use the platform for hours from the browser
Low bounce rate = destination platforms, not through platforms
Sites with the lowest bounce rates are those where users have a clear intention to stay:
-
DuckDuckGo: 28.75% 🟢
-
Bilibili: 30.71% 🟢
-
Instructure: 30.80% 🟢
-
YouTube: 37.64% 🟢
In contrast, sites with the highest bounce rates, such as OpenAI.com (78.15%) or WhatsApp.com (77.88%), are transit points—users arrive to access the app and leave quickly.
Time on site as a competitive differentiator
The global average time spent on a site is 2 minutes and 17 seconds. All sites in this ranking far exceed this average—the last-ranked site, Temu, has 4 minutes and 11 seconds, almost double the global average. The leaders (YouTube, Bilibili) exceed the average by 8-9 times. This gap reflects the difference between content consumption sites and the rest of the web.
🌍 Geographic Dimension: Domination by Regions
The ranking also reveals interesting geographical patterns:
-
🇺🇸 EE.UU. domina con Google, YouTube, Facebook, Instagram, Amazon, Netflix, Discord, Twitch
-
🇷🇺 Russia has three of its own platforms in the top 50: Yandex (7:57), Dzen.ru (7:57), VK.com (8:13), Ozon.ru (9:48) and Rutube.ru (7:19) — evidence of an increasingly closed internet
-
🇨🇳 China with Bilibili (19:01) — TikTok.com represents only the Western web version
-
🇰🇷 South Korea with Naver in the global top 3
-
🇯🇵 Japan with Yahoo.co.jp (8:34) and Amazon.co.jp (6:49)
-
🇧🇷 Brazil with UOL.com.br (6:13) as a leading Latin American portal
-
🇮🇳 India with Cricbuzz.com (5:13) — the sport of cricket generates sustained engagement
🛠️ How to Get This Data with Lookkle
All data in this article was obtained using Lookkle's Web Traffic Checker tool . This tool allows you to analyze any domain in the world and obtain the following in seconds:
-
📊 Estimated monthly traffic — total visits
-
⏱️ Time on site — average session duration
-
📄 Pages per visit — navigation depth
-
📉 Bounce rate — percentage of visits from a single page
-
🌍 Geographic distribution — countries of origin of traffic
-
🔍 Traffic sources — organic, direct, social, referral
To replicate this analysis on any competitor or benchmark in your sector, go to 👉 lookkle.com and use the Web Traffic Checker with any domain.
❓ Questions and Answers
What exactly is time on site and how is it calculated?
Time on site is the average duration of a complete user session—from when they enter the website until they leave. Analytics tools like Lookkle calculate it from the timestamps between pages visited within the same session. It is different from "time on page," which measures each individual page.
Why does YouTube surpass Netflix in web session time if Netflix is also a video service?
Because most Netflix users access it from the native app (TV, mobile, smart TV), not from a browser. Those who visit netflix.com usually do so to manage their account or browse the catalog, not to watch content directly. YouTube, on the other hand, is used almost exclusively through a browser.
Why does TikTok have such a low time on site (4:55) if it's famous for being addictive?
For the exact same reason: over 95% of TikTok consumption occurs on the mobile app, not on tiktok.com. The time on site data for the TikTok website only reflects the small percentage of users who access it from a browser.
What does it mean that WhatsApp only has 3 pages viewed per visit but almost 9 minutes of session time?
It means that WhatsApp Web users don't navigate between pages —they open a single WhatsApp Web tab and stay on it for the entire workday. It's a pattern of active tool usage, not exploratory browsing.
What is Instructure.com and why is it in the top 5?
Instructure is the company behind Canvas LMS, the most widely used learning management system in universities in the US and around the world. Students use it for hours to view materials, submit assignments, and participate in forums—hence its average session time of 11 minutes and the lowest bounce rate in the ranking (30.80%).
Why does Google have a 10-minute average time on site if its function is to send users to other websites?
Because real users perform multiple searches in a row during the same session. A person looking for information on a topic might perform 6-8 different searches, refining terms, before finding what they need—accumulating 10 minutes without ever leaving google.com.
What is Dzen.ru and why does it appear in the ranking?
Dzen.ru (formerly Yandex Zen) is Yandex's content and news platform, the Russian equivalent of Google News/Discover. With nearly 690 million monthly visits and an average time spent on site of 7:57, it is a major player in the Russian-speaking media ecosystem.
How can I improve the time on site of my own website?
The factors that have the greatest impact, according to the data from this analysis, are: video content (YouTube/Bilibili lead the way in this), navigation between related pages (X.com has 14 pages per visit), low loading speed (slow sites increase bounce rates), and an active community that provides reasons for visitors to return. Loading speed is also critical: a site that loads in 1 second converts 3 times better than one that takes 5 seconds.
How often does this data change?
Web traffic fluctuates monthly. Tools like Lookkle Web Traffic Checker update their estimates regularly, so the data in this article reflects the state of the web ecosystem at the beginning of 2026. It is recommended to check periodically to follow the trends of each platform.
What type of website has the best time on site relative to its traffic?
The best in terms of engagement/traffic ratio are Bilibili (620M visits, 19 min), Instructure (193M visits, 11 min), and Discord (309M visits, 10 min). They achieve very high engagement with lower traffic volumes than the giants, indicating an extremely loyal and active user base.