Reading Time 7
Number of Words 1469
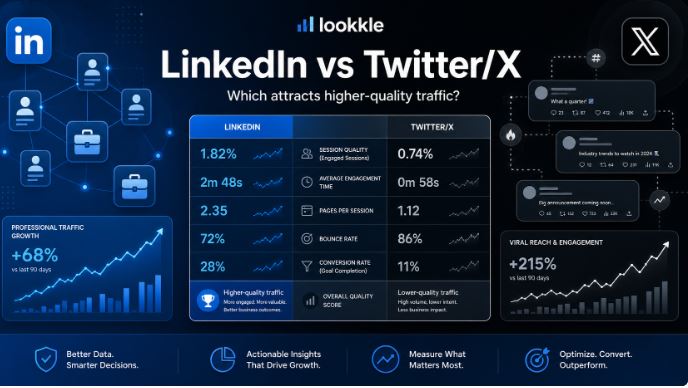
In the ever-evolving digital landscape, understanding user engagement is crucial for marketers, content creators, and businesses.
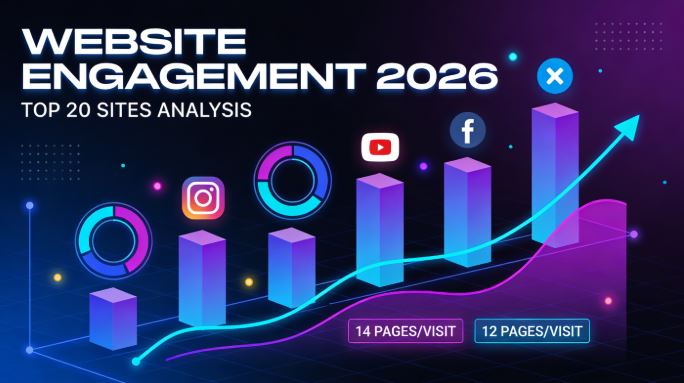
Recent comprehensive traffic analysis from February 2026 reveals a fascinating trend: video and social platforms are crushing traditional websites when it comes to user engagement.
Let's dive into the numbers that are reshaping how we think about online user behavior.
🎯 What is Pages Per Visit (Engagement)?
Before we explore the rankings, it's important to understand what "pages per visit" means. This metric measures how many pages a user views during a single session on a website. Higher numbers indicate that users are:
-
Spending more time on the platform
-
Exploring multiple pieces of content
-
Finding the content compelling enough to keep clicking
-
Highly engaged with the platform's offerings
This is one of the most important indicators of quality traffic and user satisfaction.
🏆 Top 20 Most Engaging Websites in 2026: Complete Data Analysis
Based on the latest comprehensive traffic analysis, here's the complete breakdown of the world's most visited websites with their actual engagement metrics:
Top 20 Websites - February 2026 Full Analysis
| Rank | Website | Monthly Traffic | Pages/Visit | Bounce Rate | Time on Site | Traffic from Search | Direct Traffic | Social Traffic |
|---|---|---|---|---|---|---|---|---|
| 1 | X.com (Twitter) | 2.27B | 14 🥇 | 46.65% | 12:25 | 438.6M | 1.72B | 29.3M |
| 2 | YouTube.com | 15.19B | 12 🥈 | 37.64% | 19:40 | 2.91B | 11.71B | 82.3M |
| 3 | Facebook.com | 6.03B | 12 🥈 | 45.53% | 10:02 | 1.26B | 4.52B | 29.1M |
| 4 | Instagram.com | 3.54B | 12 🥈 | 48.39% | 8:15 | 957.6M | 2.39B | 41.2M |
| 5 | Naver.com | 809.0M | 12 🥈 | 41.15% | 12:55 | 180.0M | 557.1M | 10.9M |
| 6 | TikTok.com | 1.60B | 9 | 57.79% | 4:55 | 579.0M | 958.6M | 14.8M |
| 7 | Amazon.com | 1.36B | 9 | 45.8% | 5:59 | 331.4M | 919.1M | 18.2M |
| 8 | Google.com | 42.88B | 8 | 43.36% | 10:08 | 3.58B | 36.80B | 325.9M |
| 9 | Yandex.ru | 1.43B | 8 | 41.8% | 7:57 | 204.7M | 894.2M | 127.3M |
| 10 | LinkedIn.com | 952.7M | 8 | 37.79% | 7:23 | 277.1M | 641.2M | 2.2M |
| 11 | Yahoo.co.jp | 1.52B | 7 | 48.27% | 8:34 | 450.1M | 983.1M | 5.3M |
| 12 | Bing.com | 1.73B | 6 | 46.33% | 7:57 | 92.5M | 1.43B | 13.8M |
| 13 | Temu.com | 765.7M | 5 | 61.5% | 4:11 | 203.2M | 470.2M | 28.7M |
| 14 | Yahoo.com | 1.43B | 5 | 52.77% | 6:23 | 232.7M | 1.14B | 5.4M |
| 15 | ChatGPT.com | 2.86B | 4 | 47.26% | 6:22 | 577.8M | 2.18B | 7.2M |
| 16 | Reddit.com | 2.19B | 4 | 59.2% | 5:33 | 1.46B | 696.1M | 6.2M |
| 17 | Netflix.com | 868.3M | 4 | 55.24% | 5:44 | 161.4M | 692.7M | 2.6M |
| 18 | Wikipedia.org | 1.84B | 3 | 69% | 3:16 | 1.50B | 284.7M | 8.9M |
| 19 | WhatsApp.com | 1.77B | 3 | 77.88% | 8:59 | 373.1M | 1.31B | 8.4M |
| 20 | Microsoftonline.com | 912.1M | 3 | 54.68% | 2:14 | 60.0M | 501.3M | 2.7M |
Average engagement across top 20 sites: 7.7 pages/visit
Total monthly traffic (top 20): 94.4 billion visits
🎥 The Engagement Champions: Surprising Winners
The data reveals some unexpected insights about user engagement in 2026:
🥇 #1 X.com (Twitter): 14 Pages/Visit - The Engagement King
Key Stats:
-
Monthly visits: 2.27 billion
-
Bounce rate: 46.65% (moderate)
-
Time on site: 12 minutes 25 seconds
-
75.5% direct traffic (highly engaged audience)
Why X Dominates Engagement:
-
Real-time conversation threads keep users clicking
-
Quote tweets and replies create deep engagement loops
-
Algorithm-driven "For You" feed personalizes content
-
Breaking news and trending topics drive constant refreshing
🥈 #2-5 The 12 Pages/Visit Club: Video & Social Giants
Four platforms tied with 12 pages per visit, creating an unprecedented engagement tier:
YouTube: 15.19B visits | 19:40 time on site
-
Longest session duration of any top platform
-
77% direct traffic shows strong brand loyalty
-
Recommendation algorithm keeps users watching video after video
Facebook: 6.03B visits | 10:02 time on site
-
75% direct traffic indicates habitual usage
-
Groups, Marketplace, and Video feed create multiple touchpoints
-
Despite "being old," still maintains top-tier engagement
Instagram: 3.54B visits | 8:15 time on site
-
67.5% direct traffic from mobile apps
-
Reels, Stories, Feed, and Explore create endless scroll
-
Visual-first content naturally generates more interactions
Naver: 809M visits | 12:55 time on site
-
South Korea's dominant search/portal platform
-
Integrated services (news, shopping, webtoons) boost engagement
-
68.8% direct traffic shows strong local loyalty
📈 Key Engagement Insights from the Data
1. Social Platforms Dominate the Top
The top 5 engagement leaders are all social or video platforms. Traditional search engines and utility sites rank lower despite having higher traffic volumes.
Engagement vs. Traffic Paradox:
-
Google: 42.88B visits but only 8 pages/visit
-
X.com: 2.27B visits but 14 pages/visit
This proves that traffic volume ≠ engagement quality.
2. Time on Site Doesn't Always Correlate with Pages/Visit
Surprising finding: YouTube has the longest session duration (19:40) but only 12 pages/visit, while X.com has shorter sessions (12:25) yet leads with 14 pages/visit.
Why? Video consumption is passive and continuous, while social feeds require active clicking between posts.
3. Direct Traffic Indicates Brand Strength
Platforms with 70%+ direct traffic show the strongest user habits:
-
Google: 85.8% direct
-
WhatsApp: 74.0% direct
-
YouTube: 77.1% direct
-
Facebook: 75.1% direct
These users aren't discovering the platform—they're intentionally returning daily.
4. Search Traffic Shows Discovery Opportunity
Platforms with high search traffic percentages have growth potential:
-
Wikipedia: 81.5% from search (people finding specific information)
-
Reddit: 66.7% from search (finding community discussions)
This indicates content discoverability rather than habitual use.
5. Bounce Rate Reveals Content Relevance
Lowest bounce rates (best engagement):
-
YouTube: 37.64%
-
LinkedIn: 37.79%
-
Naver: 41.15%
-
Yandex: 41.8%
Highest bounce rates (quick exits):
-
WhatsApp: 77.88% (utility-focused)
-
Wikipedia: 69% (answer-and-leave behavior)
-
Temu: 61.5% (price comparison shopping)
🔍 Traffic Source Analysis: Where Users Come From
Understanding how users discover platforms reveals engagement patterns:
Direct Traffic Champions (Habitual Users)
-
Google: 36.80B direct visits (85.8%)
-
YouTube: 11.71B direct visits (77.1%)
-
Facebook: 4.52B direct visits (75.1%)
-
Instagram: 2.39B direct visits (67.5%)
-
ChatGPT: 2.18B direct visits (76.1%)
Insight: These platforms are daily habits, not discoveries.
Search Traffic Leaders (Discovery-Driven)
-
Google: 3.58B search referrals (8.3%)
-
YouTube: 2.91B search referrals (19.2%)
-
Reddit: 1.46B search referrals (66.7%)
-
Wikipedia: 1.50B search referrals (81.5%)
-
Facebook: 1.26B search referrals (20.9%)
Insight: Content quality drives organic discovery on these platforms.
Social Traffic Winners (Viral Potential)
-
YouTube: 82.3M social referrals
-
Instagram: 41.2M social referrals
-
Google: 325.9M social referrals
-
Facebook: 29.1M social referrals
-
X.com: 29.3M social referrals
Insight: Video content generates the most social shares.
🎯 Platform Categories: Engagement by Type
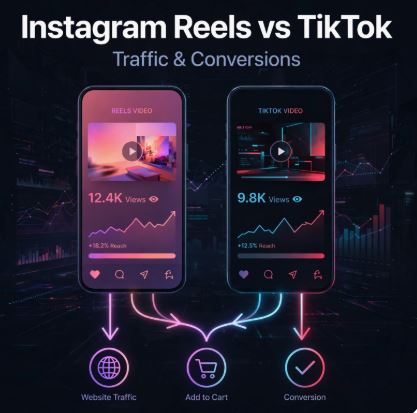
🎬 Video Platforms (Average: 10.5 pages/visit)
-
YouTube: 12 pages/visit, 19:40 session
-
TikTok: 9 pages/visit, 4:55 session
-
Netflix: 4 pages/visit, 5:44 session
Takeaway: Short-form video (TikTok) drives more page views than long-form (YouTube/Netflix).
📱 Social Networks (Average: 12.5 pages/visit)
-
X.com: 14 pages/visit
-
Facebook: 12 pages/visit
-
Instagram: 12 pages/visit
-
LinkedIn: 8 pages/visit
Takeaway: Conversation-based platforms (X) beat profile-browsing platforms (LinkedIn).
🛒 E-Commerce (Average: 7 pages/visit)
-
Amazon: 9 pages/visit
-
Temu: 5 pages/visit
Takeaway: Product browsing creates moderate engagement.
🔍 Search Engines (Average: 6.7 pages/visit)
-
Google: 8 pages/visit
-
Bing: 6 pages/visit
-
Yahoo: 5 pages/visit
Takeaway: Users arrive, search, and leave—utility over engagement.
🤖 AI Platforms (Average: 4 pages/visit)
-
ChatGPT: 4 pages/visit, 2.86B visits
Takeaway: AI chat is task-focused, not exploratory (yet).
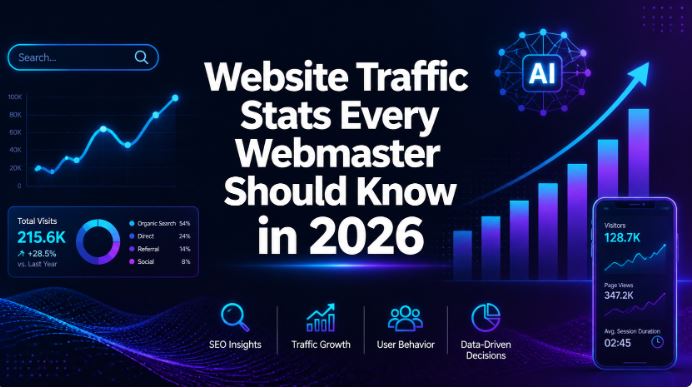
🔍 How to Measure Your Website Engagement with Lookkle
Now that you've seen how the world's biggest platforms perform, it's time to analyze your own website's engagement using Lookkle's comprehensive traffic analysis tools.
Why Use Lookkle for Engagement Analysis?
✅ Complete Traffic Metrics
Access the same data points as shown in our analysis:
-
Monthly traffic volumes
-
Pages per visit (engagement depth)
-
Bounce rates
-
Time on site
-
Traffic sources (search, direct, social)
✅ Historical Tracking
Monitor trends over months to see if your engagement is improving or declining.
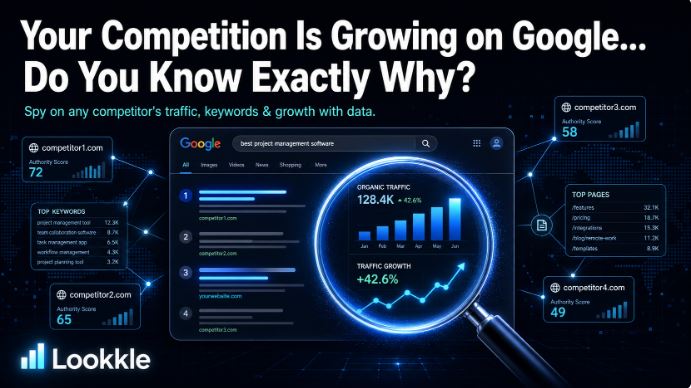
✅ Competitive Benchmarking
Compare your metrics against competitors and industry leaders to identify gaps and opportunities.
✅ Traffic Source Analysis
Understand where your most engaged users come from:
-
High direct traffic % = Strong brand loyalty
-
High search traffic % = Good SEO and content discoverability
-
High social traffic % = Viral content potential
✅ Actionable Insights
Use engagement data to:
-
Identify underperforming pages (high bounce rates)
-
Find your most engaging content (high pages/visit)
-
Optimize user journeys (time on site analysis)
-
Discover growth opportunities (traffic source gaps)
How to Use Lookkle's Traffic Checker:
-
Visit Lookkle.com
-
Enter any website URL (yours or a competitor's)
-
Analyze comprehensive metrics:
-
Total monthly visits
-
Pages per visit
-
Bounce rate
-
Average session duration
-
Traffic sources breakdown
-
-
Compare against benchmarks from this article
-
Take action based on insights
💡 Pro Tip: Aim for 8+ pages/visit to match top-tier platforms. If you're below 4, focus on internal linking and content quality improvements.
📊 Engagement Benchmarks: How Does Your Site Compare?
Based on the actual data from the top 20 platforms:
Pages Per Visit Benchmarks (2026 Standards):
-
🏆 14+ pages/visit: Best-in-class (X.com level)
-
🥇 12+ pages/visit: Exceptional (YouTube/Facebook tier)
-
🥈 8-11 pages/visit: Very High (Google/LinkedIn tier)
-
🥉 6-7 pages/visit: High (Bing/Yahoo tier)
-
🟡 4-5 pages/visit: Moderate (ChatGPT/Netflix tier)
-
🔴 3 or less: Low (Wikipedia/WhatsApp tier - utility sites)
Bounce Rate Benchmarks:
-
🟢 25-40%: Excellent engagement (YouTube: 37.64%, LinkedIn: 37.79%)
-
🟡 41-50%: Good engagement (Google: 43.36%, Facebook: 45.53%)
-
🟠 51-60%: Moderate engagement (Yahoo: 52.77%, TikTok: 57.79%)
-
🔴 61%+: Needs improvement (Temu: 61.5%, Wikipedia: 69%)
Time on Site Benchmarks:
-
🏆 15+ minutes: Exceptional (YouTube: 19:40)
-
🥇 10-15 minutes: Very High (Naver: 12:55, X.com: 12:25)
-
🥈 7-10 minutes: High (Google: 10:08, Facebook: 10:02)
-
🥉 5-7 minutes: Moderate (Amazon: 5:59, Reddit: 5:33)
-
🟡 3-5 minutes: Low (Netflix: 5:44, TikTok: 4:55)
-
🔴 Under 3 minutes: Utility-focused (Microsoftonline: 2:14)
🚀 How to Improve Your Website's Engagement (Based on Top Performers)
Learn from X.com (14 pages/visit):
✅ Create conversation threads that encourage clicking deeper
✅ Use recommendation algorithms for personalized content
✅ Implement real-time updates to encourage refreshing
✅ Foster community interaction (replies, quotes, shares)
Learn from YouTube (12 pages/visit, 19:40 time):
✅ Invest heavily in video content
✅ Use autoplay and recommended videos
✅ Create playlists that encourage binge-watching
✅ Optimize for watch time, not just views
Learn from Instagram/Facebook (12 pages/visit):
✅ Offer multiple content formats (Feed, Stories, Reels, Explore)
✅ Create infinite scroll experiences
✅ Focus on visual-first content
✅ Build community features (Groups, Comments, DMs)
Learn from Amazon (9 pages/visit):
✅ Implement "Customers also viewed" recommendations
✅ Create detailed product pages with multiple sections
✅ Use comparison tools that require multiple page views
✅ Optimize internal search to surface related products
💡 Key Takeaways for 2026
1. Conversation Beats Consumption
X.com's 14 pages/visit proves that interaction-driven platforms outperform passive consumption sites.
2. Video is Still King (But with Nuance)
YouTube's 19:40 session duration is unmatched, but TikTok's 9 pages/visit shows that short-form video drives more clicks.
3. Direct Traffic = Brand Power
Platforms with 75%+ direct traffic have unstoppable user habits. Focus on becoming a daily destination, not just a discovery.
4. Bounce Rate Context Matters
Wikipedia's 69% bounce rate isn't bad—it's functional. Users find answers and leave. Know your site's purpose before optimizing.
5. AI Platforms Have Room to Grow
ChatGPT's 4 pages/visit shows AI chatbots are still task-focused, not exploratory. Opportunity for improvement exists.
6. Social Traffic is Overrated
Even YouTube only gets 0.5% traffic from social. Focus on direct and search traffic for sustainable growth.
📊 Track Your Success with Lookkle
Stop guessing about your website's performance—measure it with precision using Lookkle's analytics platform.
Start Your Free Analysis Today:
🔗 Visit Lookkle.com to access:
-
Web Traffic Checker: Real monthly traffic data like in our analysis
-
Engagement Metrics: Pages/visit, bounce rate, time on site
-
Traffic Sources: Search, direct, and social breakdowns
-
Competitor Analysis: Compare against industry leaders
-
SEO Tools: Keyword research, ranking checker, backlink analysis
Whether you're a content creator, marketer, or business owner, understanding your engagement metrics is essential for growth in 2026.
🎯 Conclusion: The Engagement Revolution
The February 2026 data reveals a clear winner: conversation-driven and video platforms dominate user engagement.
The Numbers Don't Lie:
-
X.com: 14 pages/visit (interaction champion)
-
YouTube/Facebook/Instagram: 12 pages/visit (content titans)
-
Google: 8 pages/visit (despite 43B monthly visits)
The lesson? Raw traffic means nothing without engagement. A platform with 2 billion visits and 14 pages/visit (X.com) delivers more value to advertisers and creators than one with 43 billion visits and 8 pages/visit (Google).
Your Action Plan:
1️⃣ Measure your current engagement with Lookkle
2️⃣ Benchmark against your industry using this data
3️⃣ Implement strategies from top performers (conversation, video, personalization)
4️⃣ Track improvements monthly to validate changes
5️⃣ Focus on quality over quantity in traffic acquisition
The platforms with the highest engagement didn't achieve it by accident—they obsessively optimized based on user behavior data. Now you have access to the same insights. Use them wisely.