Reading Time 3
Number of Words 485

What Is Web Traffic History?
The Web Traffic History tool by Lookkle lets you explore how a website’s audience has evolved over time.
Instead of just showing how much traffic a site has today, it reveals the bigger picture, trends, growth, and fluctuations from the past months or years.
You can think of it as a “time machine” for web analytics: it helps you understand not just where a site is now, but how it got there.
Why Historical Traffic Data Matters
Looking at a site’s traffic history gives powerful insights:
-
📈 Track growth patterns: Identify when a website started to gain (or lose) popularity.
-
🔍 Understand market shifts: See how external events, trends, or algorithm updates affected visits.
-
⚔️ Compare competitors: Discover which brands are consistently growing versus those declining.
-
🎯 Predict future performance: Use past data to estimate where a site is heading.
In short, historical data turns static analytics into strategic insights.
How to Use the Tool
You can try it right now at 👉 Lookkle Web Traffic History Checker
Here’s how to use it step-by-step:
-
Enter a website domain
Type any site (for example: nytimes.com, etsy.com, or yourwebsite.com) into the search box. -
Click “Check History”
The tool will analyze the domain and generate a complete timeline of its traffic evolution. -
Explore the results
You’ll see:-
A traffic trend chart (visits over time).
-
The average monthly visits and traffic growth rate.
-
Optional breakdowns by country, device, and engagement metrics depending on data availability.
-
-
Compare patterns
Notice when the site’s traffic increased — maybe during product launches, viral moments, or SEO updates.
Real-World Example with shopify.com
Let’s say you analyze shopify.com using the Tool.
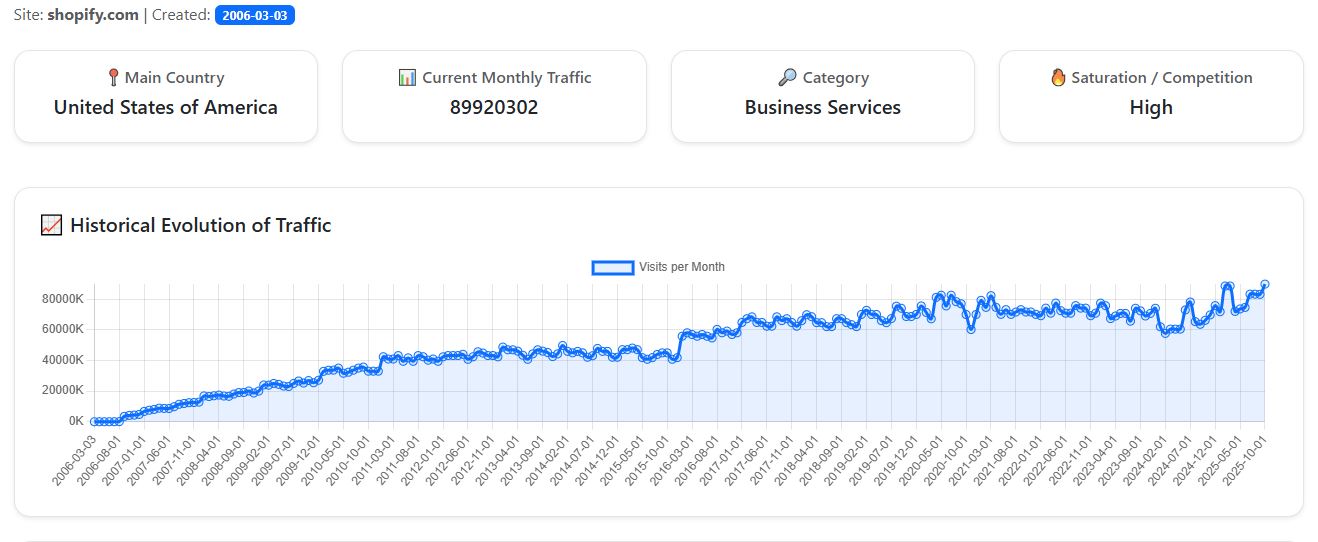
Analyzing the monthly traffic data for the shopify.com website extracted from the tool, the following can be observed regarding the increase in visits:
- There was very strong growth in February 2025 with a 23.4% increase compared to the previous month, reaching approximately 88.6 million visits.
- Another significant peak of sustained growth began in March 2025, remaining above 88 million visits, with minor fluctuations.
- In July 2025, an 11.6% increase was recorded, reaching 83.3 million visits, and in October and November, the increases recovered with 8.0% and 5.3%, respectively.
- During 2024, the most notable increase was in June with a 20.6% rise and in December with an 8.7% growth compared to previous months.
- Between 2023 and 2025, fluctuations were observed, with key months of growth and decline, but the most significant increases for Shopify occurred in:
- February 2025 (23.4% increase)
- June 2024 (20.6% increase)
- March 2021 (10.2% increase)
- January 2021 (13.2% increase)
Therefore, the most pronounced and recent increase in visits to shopify.com occurred starting in February 2025, with another moderate increase from July to October 2025, reinforcing a growth trend that year.
This data indicates that web traffic to Shopify experienced significant spikes during these months, which could be linked to marketing campaigns, SEO improvements, or events relevant to the platform at those times, maintaining a consistently high volume since then.
Pro Tips
-
Compare similar domains (e.g., wix.com vs shopify.com) to reveal who’s leading the market.
-
Combine results with Lookkle’s Site Explorer to analyze keywords, backlinks, and SEO factors behind the traffic shifts.