If you’re only guessing how much traffic your competitors are getting, you’re missing out on critical insights that could transform your marketing strategy.
The truth is: your competitors know where their visitors come from, how engaged they are, and which channels bring the best results. Do you?
Let’s take a real example and analyze CNN.com, one of the biggest news websites in the world, using Lookkle Web Traffic Checker.
Step 1 – Enter the Domain
Go to the lOOkkle Web Traffic Checker and type cnn.com in the search bar.
Click “SEARCH”.
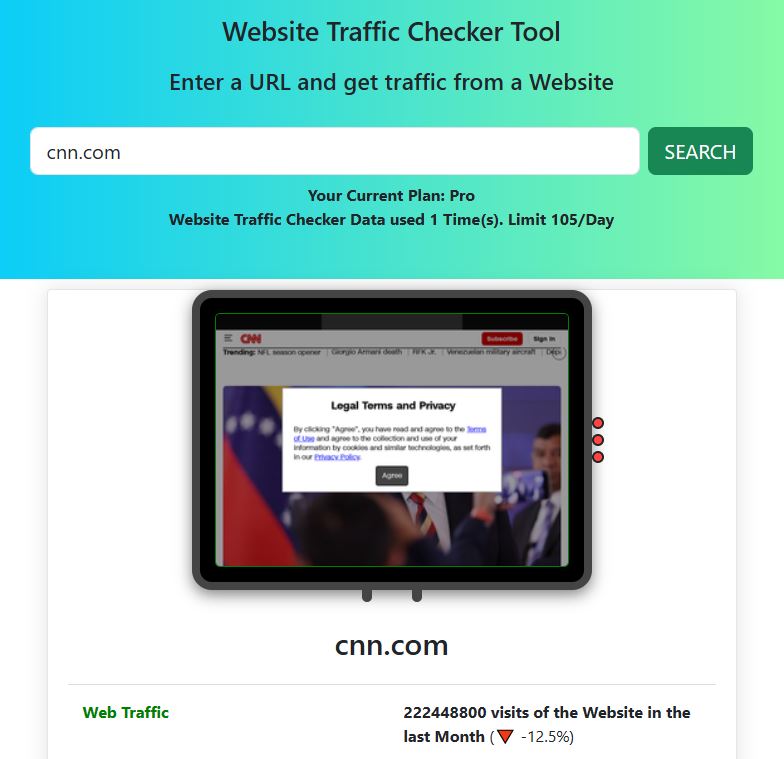
Step 2 – See Free Traffic Results
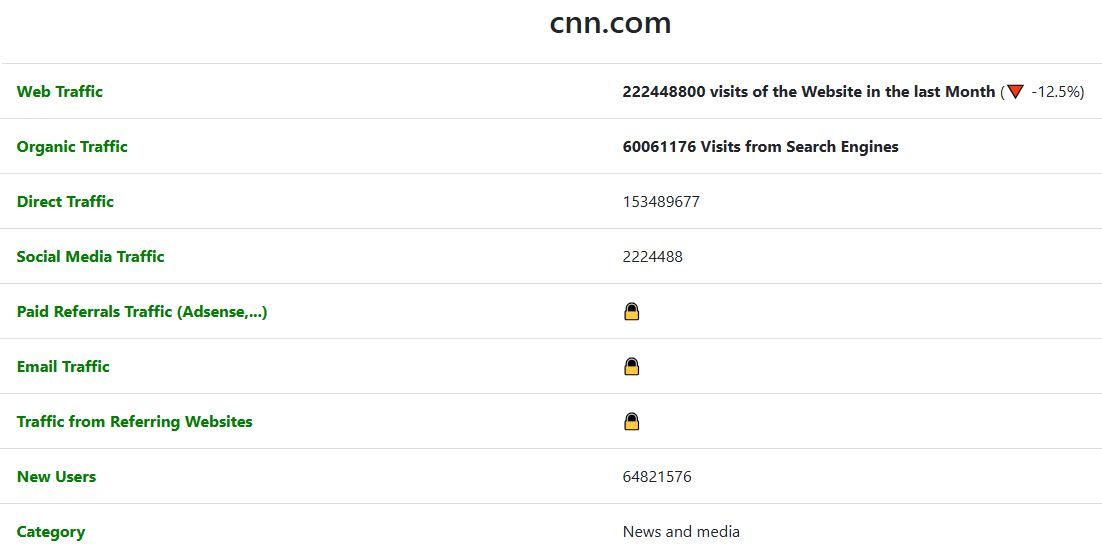
With the Free plan, Lookkle shows you an instant traffic snapshot of cnn.com. Here’s what you get for free:
-
Monthly Web Traffic: 222,448,800 visits
Total visits in the last 30 days. This shows the overall size of the website’s audience.
(Traffic dropped by 12.5% compared to the previous month — useful to detect trends and seasonality.) -
Organic Traffic: 60,061,176 visits
These are visitors coming from search engines like Google or Bing. If a competitor has strong organic traffic, it means they rank well in SEO and are capturing free long-term traffic. -
Direct Traffic: 153,489,677 visits
Visitors who typed the URL directly or used bookmarks. High direct traffic usually means brand strength and user loyalty. -
Social Media Traffic: 2,224,488 visits
Visitors coming from platforms like Facebook, Twitter (X), LinkedIn, TikTok, etc. This helps you measure how effective a competitor’s social media campaigns really are. -
New Users: 64,821,576
The number of first-time visitors. This shows how good the site is at acquiring new audiences instead of only relying on returning visitors. -
Daily Visits: 7,414,960 per day
This is the average daily reach. It helps you understand the consistency and scale of traffic flow over time.
With just these free insights, you can already compare your site against a competitor:
-
Do you attract as many new users as they do?
-
Is your SEO (organic traffic) strong enough?
-
Are you building a loyal audience (direct traffic)?
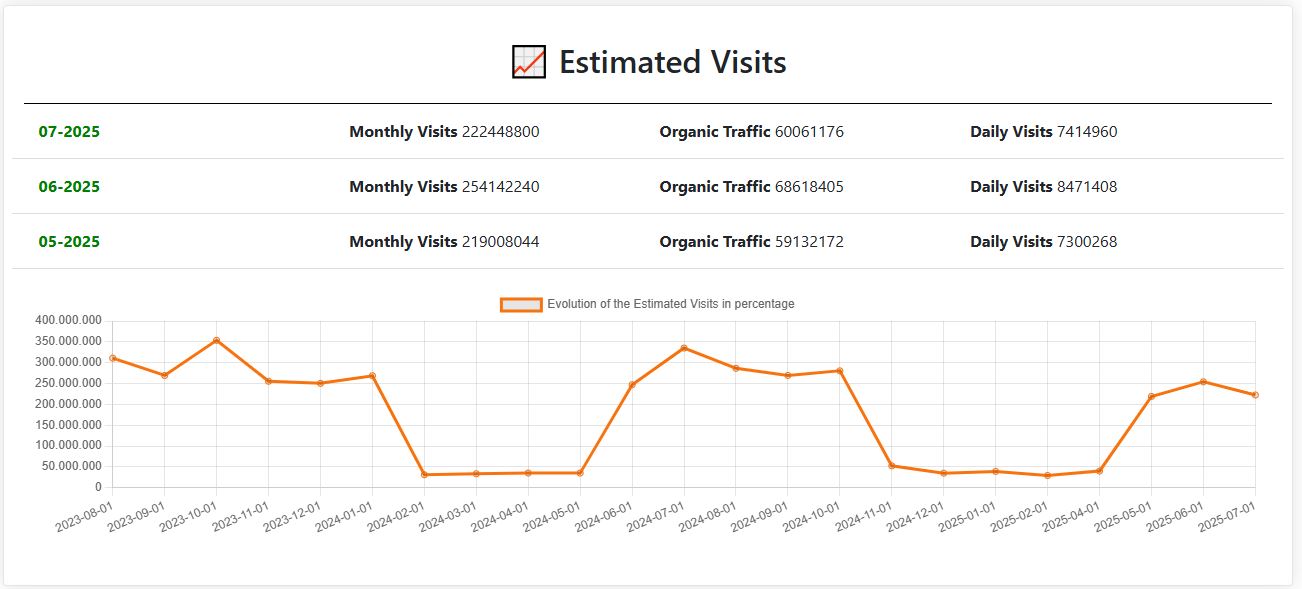
But remember — this is just the surface. To truly understand engagement, audience countries, traffic sources breakdown and historical data, you’ll need the Starter plan.
Step 3 – Unlock Full Competitor Insights
But here’s the catch: traffic totals only tell part of the story. To compete, you need to know where that traffic comes from and how it behaves.
With the Starter plan, you don’t just see traffic totals, you unlock the full story behind your competitors’ growth. These insights give you a 360º view of their audience, marketing channels, and performance trends:
-
Historical Data (last 12 months)
Track how traffic evolves month by month. Useful to detect seasonality, campaigns impact, or long-term growth/decline trends. -
Bounce Rate + Evolution
Shows the % of visitors leaving after a single page view. By seeing its evolution, you can measure whether a site is improving user engagement or losing interest. -
Pages per Visit + Evolution
How many pages users visit in one session. A higher number means deeper engagement. The evolution shows if content is becoming more or less engaging over time. -
Time on Site + Evolution
Average visit duration. Essential to evaluate content quality and stickiness. Tracking changes reveals if users are staying longer or dropping off faster. -
Organic Traffic + Evolution
Track SEO performance over time. Helpful to identify if competitors are gaining search visibility or losing rankings. -
Direct Traffic + Evolution
Shows brand strength and loyalty. Growth here usually means stronger brand recognition and repeat visitors. -
Social Media + Evolution
Measures how effective competitors are at driving traffic from platforms like Facebook, X, LinkedIn, TikTok, or Reddit. Seeing its evolution shows which networks are gaining traction. -
Paid Referrals
Traffic from paid placements on other websites. Great for spotting where competitors are investing ad budgets outside social/search. -
Email Traffic + Evolution
Visitors arriving from newsletters or email campaigns. A strong email channel often signals loyal audiences and successful remarketing. -
Referrals + Evolution
General traffic from external websites (not paid). Useful to discover partnerships, mentions, backlinks, or press coverage that bring traffic. -
Gender Distribution
Audience split between male/female. Key for tailoring content and campaigns to the right demographic. -
Age Distribution
See which age groups visit most. Helps to align marketing tone, product positioning, and ad targeting. -
Main Countries Sending Traffic
Discover geographic hotspots. Knowing the top traffic countries lets you decide where to invest in ads or content localization. -
Traffic by Device
See desktop vs mobile usage. Critical for optimizing UX and campaigns per device. -
Traffic by OS (Operating System)
Find out if visitors use Windows, MacOS, Android, iOS, or Linux. Helpful for app/web testing and ad placements. -
Traffic by Web Browsers
Chrome, Safari, Firefox, Edge, etc. Ensures you know where to optimize performance and compatibility. -
Traffic from Social Networks (Instagram, Facebook, Reddit, X, and more)
Break down social media traffic by platform. Lets you see which channels are most effective for competitors. -
Traffic by Search Engines
Google, Bing, Yahoo, DuckDuckGo, etc. Understand which engines drive visibility beyond just Google. -
Monthly Traffic from AI Tools
Visits generated by AI tools like ChatGPT, Gemini, or Copilot when recommending or linking to sites. This is a cutting-edge metric to see how AI assistants are influencing traffic. -
Similar Websites
A list of competitors or related sites in the same niche. Perfect for discovering new rivals and benchmarking beyond your main targets.
With these insights, you move from guessing to knowing exactly how your competitors attract, engage, and convert visitors.
Imagine running these reports not just on CNN, but on your direct competitors and spotting opportunities they’re missing.
Why This Matters for You
Now imagine plugging in your competitors’ websites instead of CNN.
Looking at CNN’s traffic is impressive, but the real value comes when you analyze your own competitors.
Here’s why these insights matter:
-
Stop Guessing, Start Knowing
Instead of assuming where your competitors’ visitors come from, you can see the exact channels (search, social, direct, referrals, email, AI tools). This lets you understand which strategies are working for them — and adapt them for your own growth. -
Benchmark Your Performance
By comparing bounce rate, pages per visit, and time on site, you can measure how engaged your audience is versus your competitors’. If your numbers are weaker, you know exactly where to improve. -
Discover Market Opportunities
Seeing the main countries sending traffic to a competitor may reveal markets you haven’t targeted yet. For example, if CNN is getting strong traffic from Canada or the UK, you could consider campaigns in those regions too. -
Understand Audience Demographics
Gender and age distribution data help you build precise buyer personas. Knowing if your competitor has a younger or older audience gives you clues on how to adjust your content and advertising tone. -
Optimize Your Marketing Spend
By tracking paid referrals, email campaigns, and social media traffic, you’ll see where competitors are investing their budgets. This saves you money by avoiding guesswork and focusing only on proven channels. -
Stay Ahead of the Curve with AI Traffic
AI assistants like ChatGPT, Gemini, or Copilot are already influencing traffic flows by recommending websites. Knowing if your site (or a competitor’s) is being promoted by these tools is a new advantage most marketers still overlook. -
Spot New Rivals Before They Overtake You
The Similar Websites feature helps you discover upcoming competitors in your niche, so you can track them early and avoid being caught off guard.
Try It Yourself
You can try the Free plan today and run up to 10 traffic checks per day. But if you want the full picture, Starter unlocks over 750+ full reports every month for just $19.95/month (less than $0.70/day).