Reading Time 6
Number of Words 1247
What does the internet really look like in 2026?
Which platform captures the most attention, retains users the longest, and converts casual visitors into engaged audiences?
Using official data from Lookkle.com's Web Traffic Checker, one of the most comprehensive web analytics tools available, we analyzed the three most emblematic online platforms: Google, YouTube, and X.com (formerly Twitter).
The results are revealing, and some of them are genuinely surprising.
📊 The Data at a Glance
All figures below are sourced directly from Lookkle Web Traffic Checker, measured in monthly visits as of early 2026:
| Metric | Google.com | YouTube.com | X.com |
|---|---|---|---|
| Monthly Traffic | 42,878,287,308 | 15,186,872,463 | 2,270,793,722 |
| Bounce Rate | 43.36% | 37.64% | 46.65% |
| Pages per Visit | 8 | 12 | 14 |
| Time on Site | 00:10:08 | 00:19:40 | 00:12:25 |
| Search Traffic | 3,578,574,834 | 2,912,627,716 | 438,607,334 |
| Direct Traffic | 36,801,144,419 | 11,709,030,872 | 1,715,051,049 |
| Social Traffic | 325,850,501 | 82,347,947 | 29,263,893 |
Source: Lookkle Web Traffic Checker — 2026
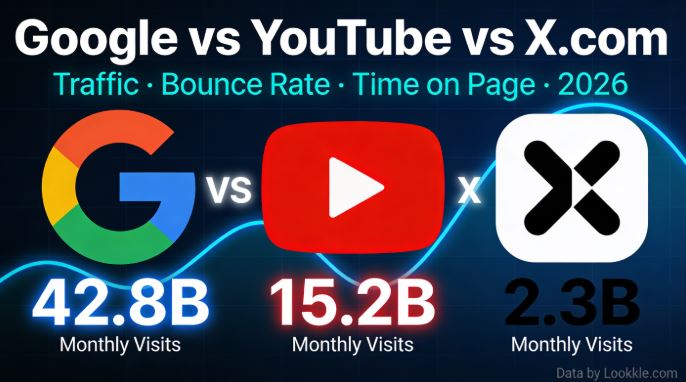
🌍 Total Traffic: Google's Dominance Is Staggering
With 42.87 billion monthly visits, Google is not just the most visited website on the internet — it operates in an entirely different league. YouTube, the world's second most visited site, receives 15.19 billion visits — impressive by any standard, but still less than 36% of Google's traffic. X.com, despite its cultural relevance and constant media coverage, attracts 2.27 billion monthly visits — just 5.3% of Google's volume.
To put this in perspective: Google receives more visits in a single day than X.com receives in an entire month.
Key takeaway for marketers and content creators: Google's dominance means that SEO and organic search remain the most powerful traffic acquisition channels on the planet — by an enormous margin over social media platforms like X.com.
Generated chart: chart.png
📉 Bounce Rate: Who Keeps Users Engaged?
Bounce rate measures the percentage of visitors who leave after viewing only one page — the lower the bounce rate, the more engaged the audience.
| Platform | Bounce Rate | Interpretation |
|---|---|---|
| YouTube.com | 37.64% ✅ | Best — users explore multiple pages/videos |
| Google.com | 43.36% | Good — users find what they need and move on |
| X.com | 46.65% | Highest — many visitors arrive and leave quickly |
YouTube's 37.64% bounce rate is the lowest of the three — and genuinely exceptional for a platform at this scale. This makes sense: when a user lands on a YouTube video, the autoplay queue, recommendations sidebar, and comment section all create powerful reasons to stay and browse further.
Google's 43.36% bounce rate reflects its nature as a search gateway. Users arrive with a specific query, find their answer (sometimes directly on the results page via featured snippets), and leave satisfied — which is actually a success metric for Google's business model, not a failure.
X.com's 46.65% bounce rate is the highest of the three. This suggests that a significant portion of X.com visitors arrive via external links (shared tweets, news articles), read the specific content they came for, and immediately leave without exploring further — a behavior pattern consistent with social media consumption.
📌 Lookkle insight: Among all 60+ websites in the dataset, the platforms with the lowest bounce rates tend to be video-heavy or socially engaging environments — YouTube (37.64%), LinkedIn (37.79%), and live.com (36.86%) are the standout performers.
📄 Pages per Visit: X.com Surprises Everyone
This is where the data delivers its biggest surprise.
| Platform | Pages per Visit |
|---|---|
| X.com | 14 |
| YouTube.com | 12 |
| Google.com | 8 |
Despite having the highest bounce rate, X.com leads all three platforms with 14 pages per visit. This apparent contradiction actually makes perfect sense: X.com users who do stay on the platform are extremely engaged scrollers — they browse timelines, profile pages, thread conversations, and trending topics in rapid succession, generating a high page count per session.
YouTube follows with 12 pages per visit, driven by its powerful recommendation engine that pulls users from one video to the next. Google's 8 pages per visit reflects its role as a launcher — users arrive, search, click outward, and return to search again, each cycle counting as multiple page interactions.
Generated chart: chart.png
⏱️ Time on Site: YouTube Wins by a Massive Margin
When it comes to capturing and holding user attention, the data is unambiguous:
| Platform | Time on Site | Equivalent |
|---|---|---|
| YouTube.com | 00:19:40 🏆 | Nearly 20 minutes per visit |
| X.com | 00:12:25 | Over 12 minutes per visit |
| Google.com | 00:10:08 | Just over 10 minutes per visit |
YouTube's 19 minutes and 40 seconds average session time is extraordinary. For a platform receiving 15+ billion visits per month, sustaining nearly 20 minutes of engagement per visit represents an almost incomprehensible total consumption of human time. This confirms YouTube's position as not just a video platform, but as a primary entertainment and information medium competing directly with traditional television.
X.com's 12 minutes and 25 seconds is stronger than many would expect, especially given its higher bounce rate. It confirms the platform's role as a habitual, deeply engaging feed-scrolling environment for its active users.
Google's 10 minutes and 8 seconds is respectable, particularly given that many Google sessions are brief transactional searches. The 10-minute average suggests that a large portion of Google's sessions involve complex, multi-search research sessions that contribute significantly to this figure.
🚦 Traffic Sources: Where Do Visitors Come From?
This is perhaps the most strategically important section for anyone building an online presence.
Generated chart: chart.png
Google.com: The Direct Traffic Titan
| Source | Visits | % of Total |
|---|---|---|
| Direct | 36,801,144,419 | 85.8% |
| Search | 3,578,574,834 | 8.3% |
| Social | 325,850,501 | 0.8% |
An astonishing 85.8% of Google's traffic is direct — users typing "google.com" directly into their browser or clicking a bookmark. This is the strongest brand recognition signal possible: billions of people have made Google an unconscious daily habit. Only 8.3% of Google's own traffic comes from search engines (primarily from Google appearing in other search results), and social media contributes a tiny 0.8%.
YouTube.com: Also Dominated by Direct Traffic
| Source | Visits | % of Total |
|---|---|---|
| Direct | 11,709,030,872 | 77.1% |
| Search | 2,912,627,716 | 19.2% |
| Social | 82,347,947 | 0.5% |
YouTube follows the same pattern, with 77.1% direct traffic. Notably, 19.2% of YouTube's traffic comes from search — a much higher search-to-direct ratio than Google itself, driven by people discovering YouTube videos through Google search results. Social traffic is a negligible 0.5%, which should be a wake-up call for anyone who believes that sharing YouTube videos on social media drives significant views.
X.com: The Most "Social-Dependent" of the Three
| Source | Visits | % of Total |
|---|---|---|
| Direct | 1,715,051,049 | 75.5% |
| Search | 438,607,334 | 19.3% |
| Social | 29,263,893 | 1.3% |
Even X.com — a social network — gets 75.5% of its traffic directly. Only 19.3% arrives via search, and a surprisingly low 1.3% comes from social media referrals. This tells us that X.com users are also creatures of habit, accessing the platform by going directly to the URL or app rather than being referred from other social networks.
🔍 Context: How Do They Compare Against the Full Top 60?
Looking at the Lookkle dataset of 60+ major websites, here's where each platform ranks:
| Metric | YouTube | X.com | |
|---|---|---|---|
| Total traffic rank | #1 | #2 | #6 |
| Lowest bounce rate | Top 10 | Top 3 | Average |
| Highest time on site | Average | #1 (tied with Bilibili) | Top 10 |
| Pages per visit | Average | Above average | Top 5 |
For reference, other notable platforms in the dataset:
-
Facebook (6.02B visits, 45.53% bounce, 10:02 min) performs very similarly to Google in engagement but at 1/7th the traffic
-
TikTok (1.59B visits) has a high bounce rate of 57.79% and only 4:55 min on site — surprisingly low for a platform built around addictive short video
-
Wikipedia has the worst engagement metrics in the top 20: 69% bounce rate and only 3:16 min on site — classic "look up and leave" behavior
-
Bilibili (642M visits) rivals YouTube with 19:01 min on site and only 30.71% bounce rate — the second-best engagement platform in the entire dataset
💡 What This Data Means for Your Website
If you're building or growing an online presence, here are the actionable takeaways from this Lookkle analysis:
-
Direct traffic is everything — All three giants get 75–86% of their traffic directly. Building brand recognition and habitual return visits is more valuable than any single traffic campaign.
-
Video creates unrivaled engagement — YouTube's 19:40 min session time is the highest in the dataset for any platform above 1B monthly visits. If you want users to spend time with your content, video is the most powerful format available.
-
Social media as a traffic source is overrated — Even X.com, a social network, gets only 1.3% of its own traffic from social referrals. Social media drives awareness, not necessarily direct traffic in large volumes.
-
High pages per visit ≠ low bounce rate — X.com's data proves this: 14 pages per visit but 46.65% bounce rate. Engaged users who stay go deep; but many visitors don't stay at all.
-
SEO drives discovery, direct traffic drives volume — YouTube's 19.2% search-sourced traffic shows that search engines are a major discovery channel for content platforms — making SEO investment critical even for social and video platforms.