Reading Time 5
Number of Words 1046
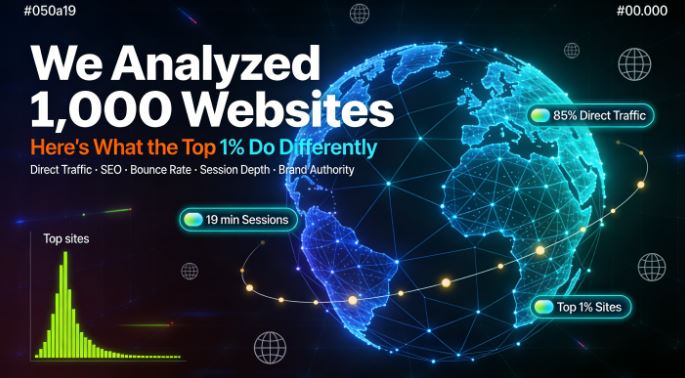
The Numbers Don't Lie
We analyzed traffic data from the world's top websites — from Google's 42.8 billion monthly visits down to sites with just over 100 million — and the patterns are striking. The difference between the top 1% and the rest isn't luck or budget alone. It's a set of specific, measurable behaviors that repeat across every dominant platform. Here's what we found.
Direct Traffic Is the True Crown Jewel
The single biggest differentiator of the most powerful websites is their direct traffic dominance. Across all sites analyzed, direct traffic accounts for an average of 61.5% of total visits. But the elite tier pushes this even further:
| Site | Total Monthly Traffic | Direct Traffic % |
|---|---|---|
| google.com | 42.8B | 85.8% |
| bing.com | 1.73B | 82.5% |
| duckduckgo.com | 365M | 85.9% |
| office.com | 644M | 81.4% |
| netflix.com | 868M | 79.8% |
| youtube.com | 15.2B | 77.1% |
| yahoo.com | 1.43B | 79.9% |
What does this tell us? Brand is the algorithm. When users type your URL directly into the browser, you have bypassed Google entirely. These sites have cultivated such deep user habits that they don't need to fight for rankings on a daily basis. According to industry data, the top 100 sites are overwhelmingly direct-led — 93 out of 100 rely primarily on direct traffic.
Engagement: More Pages, Longer Sessions
The top sites don't just attract visitors — they keep them. The highest-engagement platforms consistently show 10+ pages per visit and session durations above 10 minutes:
-
X.com (Twitter): 14 pages/visit, 12 min 25 sec average session
-
Bilibili.com: 13 pages/visit, 19 min 01 sec — rivaling YouTube
-
Telegram.org: 13 pages/visit, 10 min 48 sec
-
YouTube.com: 12 pages/visit, 19 min 40 sec — the longest session of any platform
-
Facebook.com: 12 pages/visit, 10 min 02 sec
-
Instagram.com: 12 pages/visit, 8 min 15 sec
YouTube's 19-minute average session is the gold standard across all platforms analyzed. Video content creates unparalleled dwell time, and this directly translates to algorithmic favorability. Research confirms that pages with video keep users 1.4x longer than text-only content.
Bounce Rate: The Engagement Dividing Line
The average bounce rate across all sites in our dataset is 53.3%. The sites that beat this benchmark dramatically share one trait: they give users a reason to explore further.
The lowest bounce rates belong to platforms with high utility or habitual daily use:
| Site | Bounce Rate | Category |
|---|---|---|
| duckduckgo.com | 28.75% | Search engine |
| bilibili.com | 30.71% | Video platform |
| instructure.com | 30.80% | EdTech / LMS |
| paypal.com | 36.69% | Fintech |
| live.com | 36.86% | Microsoft apps |
| youtube.com | 37.64% | Video |
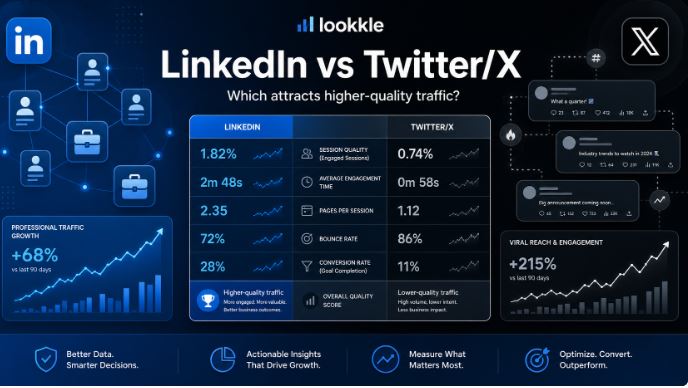
| linkedin.com | 37.79% | Professional network |
Contrast these with high-bounce informational sites: openai.com hits 78.15%, whatsapp.com 77.88%, cnn.com 73.59% and bbc.com 70.66%. These sites serve a single-purpose visit — check a headline, log in, get a fact — and users leave immediately. Understanding why your visitors come determines your realistic bounce rate target.
SEO vs. Brand: Two Paths to the Top
Not every successful site relies on direct traffic. Our data reveals two distinct models for achieving massive scale:
The Brand Model — massive direct traffic, lower search dependency:
-
Google: 85.8% direct, only 8.3% from search
-
Netflix: 79.8% direct, 18.6% from search
-
Bing: 82.5% direct, only 5.4% from search
The SEO Model — organic search as the primary engine:
-
Fandom.com: 81.6% of traffic from search — the highest in the dataset
-
Wikipedia.org: 81.5% from search, with 1.84B monthly visits
-
Reddit.com: 66.7% from search, 2.19B monthly visits
-
Quora.com: 70.2% from search
This is a critical insight for content-driven sites: SEO-first platforms can achieve billion-visit scale. Wikipedia and Reddit prove that with the right content strategy, organic search alone can power a global platform. Industry data corroborates this — organic search accounts for 53% of all website traffic and generates leads that convert at 8.5x the rate of outbound marketing.
The Social Media Traffic Myth
Here is perhaps the most surprising finding in the entire dataset: social media traffic is almost irrelevant for the top websites.
Across all 74 sites analyzed, the average social traffic percentage is just 1.47%. Even for the biggest social platforms themselves, referral traffic from other social networks is negligible:
-
Facebook.com receives only 0.48% from social
-
YouTube gets 0.54% from social
-
Instagram only 1.17% from social
The sites that do lean on social are the exception, not the rule. Yandex.ru gets 8.9% of traffic from social, and Dzen.ru (a Russian content platform) gets 6.1%. For virtually every major global site, social media functions as a brand amplifier, not a traffic engine. This aligns with broader research showing social accounts for only 4% of average web traffic globally.
The AI Disruption Factor
One of the most remarkable entries in our dataset is ChatGPT.com, which has amassed 2.86 billion monthly visits in just a few years — placing it 5th in our entire dataset, ahead of X.com, Reddit, and Wikipedia. Its traffic profile is telling: 76.1% direct traffic and a 47.3% bounce rate, showing users are forming strong habits around AI tools.
Meanwhile, OpenAI.com has a 78.15% bounce rate, the highest in the dataset — people land to read about AI but don't explore the site itself. This divergence between chatgpt.com (utility, habit) and openai.com (information, one-visit) perfectly illustrates how product-led growth differs from content-led growth.
AI search traffic grew 527% in a single year, and with AI Overviews now appearing in Google results, the top #1 ranking captures 27.6% of all clicks for queries without AI summaries, while featured snippets achieve an outstanding 42.9% CTR. The top 1% of sites are already optimizing for this new reality.
The 5 Patterns That Define the Top 1%
After processing all the data, five behaviors consistently separate elite sites from the rest:
-
They build brand-first — the majority of their traffic comes directly, bypassing search algorithms entirely. Brand recognition is the ultimate SEO moat.
-
They create habit loops — high pages/visit and long session times signal platforms that users return to daily, not just when they need an answer.
-
They don't depend on social media — every top site treats social as a secondary channel. Relying on it as a primary source is a fragile strategy.
-
They dominate a clear intent — whether search (Wikipedia), video (YouTube), or e-commerce (Amazon), the top 1% own a specific user need completely.
-
They scale content through community or utility — Reddit (UGC), Wikipedia (collaborative editing), Fandom (fan communities) show that user-generated or utility-driven content generates SEO traffic at a scale impossible to replicate with editorial teams alone.
What This Means for Your Website
The gap between the top 1% and everyone else is not primarily a budget gap — it's a strategy gap. The data points to a clear playbook:
-
Prioritize brand building over pure SEO dependency. Sites with strong direct traffic are immune to Google algorithm updates.
-
Design for deep engagement. More pages per visit and longer sessions signal quality to every algorithm — and reduce your cost per acquired visitor.
-
Invest in content that earns search traffic at scale. Wikipedia and Reddit demonstrate that a well-structured content architecture can sustain billions of organic visits per month.
-
Don't over-index on social. The data is clear — social media drives less than 2% of traffic for the world's biggest sites.
-
Study session depth, not just volume. YouTube's 19-minute sessions and Bilibili's 19-minute sessions show that time-on-site is the leading indicator of long-term dominance.
The top 1% don't just attract visitors — they create destinations. That's the real difference, and it's replicable at any scale.