Reading Time 5
Number of Words 979
What do YouTube, Telegram, and DuckDuckGo have in common?
When a user arrives at them, they stay; they don't bounce, they don't close the tab, they don't go back to the search engine. They enter, explore, and consume, sometimes for twenty minutes, other times for hours.
In the world of digital marketing, the metric that measures exactly this is called bounce rate: the percentage of visitors who leave a website without taking any further action.
The lower that number is, the more trapped the users become.
And in 2026, with billions of pages vying for the same attention, the ability to hook a user in the first few seconds has become the most decisive factor in digital success.
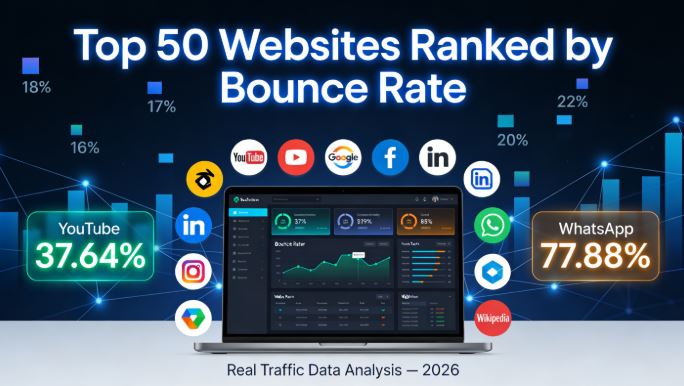
Using Lookkle Web Traffic Checker , we analyzed the most visited websites on the planet and ranked them by their actual bounce rate, from lowest to highest, to discover which 50 websites best know how to retain their users, and more importantly: exactly what they do to achieve this .
The results are surprising. A privacy search engine tops the list ahead of YouTube. A Chinese video platform rivals Netflix in session time. And some of the world's most recognized brands have bounce rates that should give them pause.
🔍 What Is Bounce Rate?
Bounce rate is the percentage of visitors who land on a page and leave without interacting further — no second page visited, no click, no form submitted. A low bounce rate means users are actively exploring the site. A high bounce rate means they're arriving and leaving almost immediately.
However, context matters enormously. A 70% bounce rate on a Wikipedia reference page is expected and acceptable — users found their answer and left satisfied. The same rate on an e-commerce product page would be a serious conversion problem. The real question is never just "is my bounce rate high?" — it's "are users getting what they came for?"
🎯 Why Bounce Rate Matters in 2026
Bounce rate has evolved from a vanity metric into a genuine strategic tool:
-
Measures content relevance — if users leave instantly, your content isn't matching their intent
-
Impacts conversions directly — every bounce on a product or landing page is a lost opportunity
-
Reflects UX quality — slow load times, poor mobile design and confusing navigation all spike bounce rates
-
Informs SEO strategy — Google uses engagement signals as quality indicators for ranking decisions
-
Benchmarks your competition — knowing where you stand versus the biggest sites in the world gives you a realistic performance target
-
Guides content and design decisions — pages with low bounce rates reveal exactly what your audience wants
📏 What Is a Good Bounce Rate?
| Bounce Rate | Rating | Context |
|---|---|---|
| < 35% | 🟢 Exceptional | Apps, dashboards, video platforms |
| 35% – 45% | 🟢 Excellent | Search engines, social networks, portals |
| 45% – 55% | 🟡 Average | E-commerce, corporate, streaming |
| 55% – 65% | 🟠 Above average | News, reference sites |
| 65% – 80% | 🔴 High | Single-purpose sites, weather, apps |
| 80%+ | 🔴 Critical | Needs urgent attention |
🏆 Top 50 Websites Ranked by Bounce Rate (Lowest = Best Engagement)
All data obtained with Lookkle Web Traffic Checker
| # | Website | Bounce Rate | Pages/Visit | Time on Site |
|---|---|---|---|---|
| 🥇 1 | duckduckgo.com | 28.75% | 6 | 00:07:17 |
| 🥈 2 | bilibili.com | 30.71% | 13 | 00:19:01 |
| 🥉 3 | instructure.com | 30.80% | 8 | 00:11:00 |
| 4 | paypal.com | 36.69% | 5 | 00:02:27 |
| 5 | live.com | 36.86% | 7 | 00:06:22 |
| 6 | youtube.com | 37.64% | 12 | 00:19:40 |
| 7 | linkedin.com | 37.79% | 8 | 00:07:23 |
| 8 | telegram.org | 40.04% | 13 | 00:10:48 |
| 9 | roblox.com | 40.19% | 7 | 00:08:37 |
| 10 | ozon.ru | 40.23% | 12 | 00:09:48 |
| 11 | office.com | 41.14% | 8 | 00:10:29 |
| 12 | naver.com | 41.15% | 12 | 00:12:55 |
| 13 | booking.com | 41.50% | 8 | 00:07:37 |
| 14 | canva.com | 41.57% | 6 | 00:06:00 |
| 15 | yandex.ru | 41.80% | 8 | 00:07:57 |
| 16 | google.com | 43.36% | 8 | 00:10:08 |
| 17 | zoom.us | 44.22% | 3 | 00:03:09 |
| 18 | indeed.com | 44.46% | 10 | 00:07:48 |
| 19 | facebook.com | 45.53% | 12 | 00:10:02 |
| 20 | amazon.com | 45.80% | 9 | 00:05:59 |
| 21 | bing.com | 46.33% | 6 | 00:07:57 |
| 22 | twitch.tv | 46.59% | 4 | 00:07:23 |
| 23 | amazon.de | 46.59% | 9 | 00:05:57 |
| 24 | x.com | 46.65% | 14 | 00:12:25 |
| 25 | chatgpt.com | 47.26% | 4 | 00:06:22 |
| 26 | vk.com | 47.59% | 11 | 00:08:13 |
| 27 | amazon.co.uk | 48.08% | 7 | 00:05:15 |
| 28 | yahoo.co.jp | 48.27% | 7 | 00:08:34 |
| 29 | instagram.com | 48.39% | 12 | 00:08:15 |
| 30 | discord.com | 48.86% | 9 | 00:10:42 |
| 31 | dzen.ru | 49.58% | 5 | 00:07:57 |
| 32 | pinterest.com | 50.64% | 8 | 00:07:10 |
| 33 | github.com | 51.08% | 6 | 00:06:21 |
| 34 | amazon.co.jp | 51.24% | 8 | 00:06:49 |
| 35 | mail.ru | 52.16% | 8 | 00:06:10 |
| 36 | yahoo.com | 52.77% | 5 | 00:06:23 |
| 37 | imdb.com | 53.30% | 4 | 00:02:44 |
| 38 | samsung.com | 53.61% | 2 | 00:01:37 |
| 39 | ebay.com | 53.86% | 7 | 00:06:18 |
| 40 | etsy.com | 54.63% | 6 | 00:04:43 |
| 41 | disneyplus.com | 54.66% | 4 | 00:07:46 |
| 42 | microsoftonline.com | 54.68% | 3 | 00:02:14 |
| 43 | netflix.com | 55.24% | 4 | 00:05:44 |
| 44 | adobe.com | 56.89% | 5 | 00:03:29 |
| 45 | marca.com | 57.38% | 3 | 00:05:21 |
| 46 | msn.com | 57.70% | 5 | 00:06:15 |
| 47 | tiktok.com | 57.79% | 9 | 00:04:55 |
| 48 | spotify.com | 58.07% | 5 | 00:05:32 |
| 49 | aliexpress.com | 58.50% | 4 | 00:04:12 |
| 50 | reddit.com | 59.20% | 4 | 00:05:33 |
🔬 Key Insights from the Data
🥇 The Engagement Champions
DuckDuckGo leads with the lowest bounce rate: 28.75%. Despite being primarily a search engine — a category where users typically leave immediately — DuckDuckGo's privacy-focused positioning and clean interface create a surprisingly sticky experience with 6 pages per visit and over 7 minutes on site.
Bilibili (China's video platform) is the second most engaging site in the world at 30.71% bounce rate, with 13 pages per visit and an extraordinary 19 minutes on site. This rivals YouTube's 19:40 average and confirms that long-form video paired with community features is the most powerful engagement combination on the internet.
Telegram.org at 40.04% bounce rate with 13 pages per visit is a standout surprise. Users don't just visit to download the app — they actively explore channels, bots and features, spending nearly 11 minutes per session on the site.
📊 The Paradox: High Traffic + High Bounce Rate
Some of the most visited sites in the world have intentionally high bounce rates — and it works perfectly for them:
-
Reddit at 59.20% — users arrive to read one specific thread and leave satisfied. With 2.1 billion monthly visits, the model clearly works despite what the bounce rate suggests
-
Spotify at 58.07% — most users visit a single artist or playlist page directly from a link and then switch to the app
-
TikTok at 57.79% — the real engagement happens in the app, not the browser; the website is a funnel, not a destination
⚡ The X.com Anomaly: Best Pages-Per-Visit
X.com posts a 46.65% bounce rate — but 14 pages per visit, the highest in the entire dataset, with 12 minutes 25 seconds on site. This combination reveals a platform where users who don't bounce immediately dive extremely deep, exploring threads, profiles and trending topics in highly engaged sessions.
🛒 Amazon's Multi-Regional Dominance
Amazon appears three times in the ranking across its regional domains — and all three perform consistently:
| Domain | Bounce Rate | Pages/Visit |
|---|---|---|
| amazon.com | 45.80% | 9 |
| amazon.de | 46.59% | 9 |
| amazon.co.jp | 51.24% | 8 |
This consistency across markets reveals how Amazon's recommendation engine — "customers also bought", bundled deals, recently viewed sections — successfully converts browsers into multi-page explorers regardless of geography.
💡 How to Improve Your Bounce Rate: Lessons from the Top 50
Based on what the best-performing sites in this analysis do differently:
-
Match content to intent precisely — DuckDuckGo and Google succeed because they deliver exactly what users searched for, instantly
-
Build content loops — YouTube, Bilibili and Telegram keep users moving from one piece of content to the next automatically
-
Speed up your page — Samsung.com's 1:37 average time on site with a 53.61% bounce rate signals that slow or thin product pages drive users away fast
-
Improve mobile UX — over 60% of web traffic is mobile; a poor mobile experience is the single biggest driver of high bounce rates
-
Add smart internal links — guide users naturally to related content, exactly as Amazon's product recommendation engine does
-
Create community features — Discord's 48.86% bounce rate with 10 minutes 42 seconds on site shows how community-driven platforms retain users far better than single-purpose tools
🏭 Average Bounce Rate by Industry (2026)
For context, here's how these global giants compare to industry averages:
| Industry | Average Bounce Rate |
|---|---|
| Video platforms | 30% – 38% |
| Search engines | 28% – 44% |
| Social networks | 45% – 50% |
| E-commerce | 41% – 55% |
| Streaming / Entertainment | 48% – 58% |
| News & Media | 56% – 73% |
| Reference / Knowledge | 60% – 80% |
| Weather / Single-purpose | 65% – 80% |
🏁 The Bottom Line
Bounce rate in 2026 is not a simple pass-or-fail metric — it's a contextual signal that requires interpretation. DuckDuckGo's 28.75% and Bilibili's 30.71% represent genuine engineering of engagement through smart UX, content loops and community features. Reddit's 59.20% and Spotify's 58.07% represent successful single-intent visits where users get exactly what they came for.
The sites that win are the ones that understand why users arrive — and design every element of the experience around fulfilling that intent as deeply as possible.
📊 All traffic data and bounce rate statistics in this article were obtained exclusively using Lookkle Web Traffic Checker — the web analytics tool that gives you real-time traffic data, bounce rates, engagement metrics and competitive analysis for any website on the internet, completely free.
🔗 Analyze any website now → lookkle.com