Reading Time 3
Number of Words 665
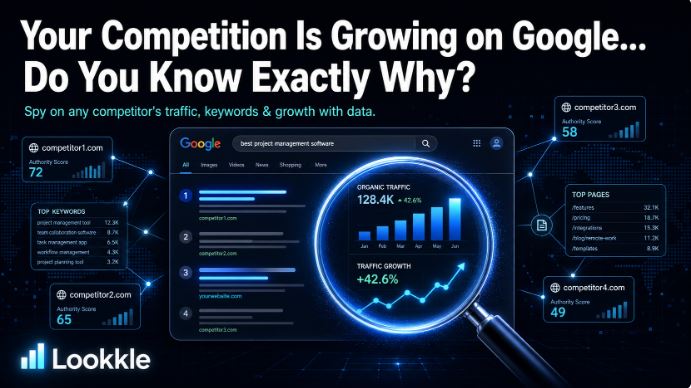
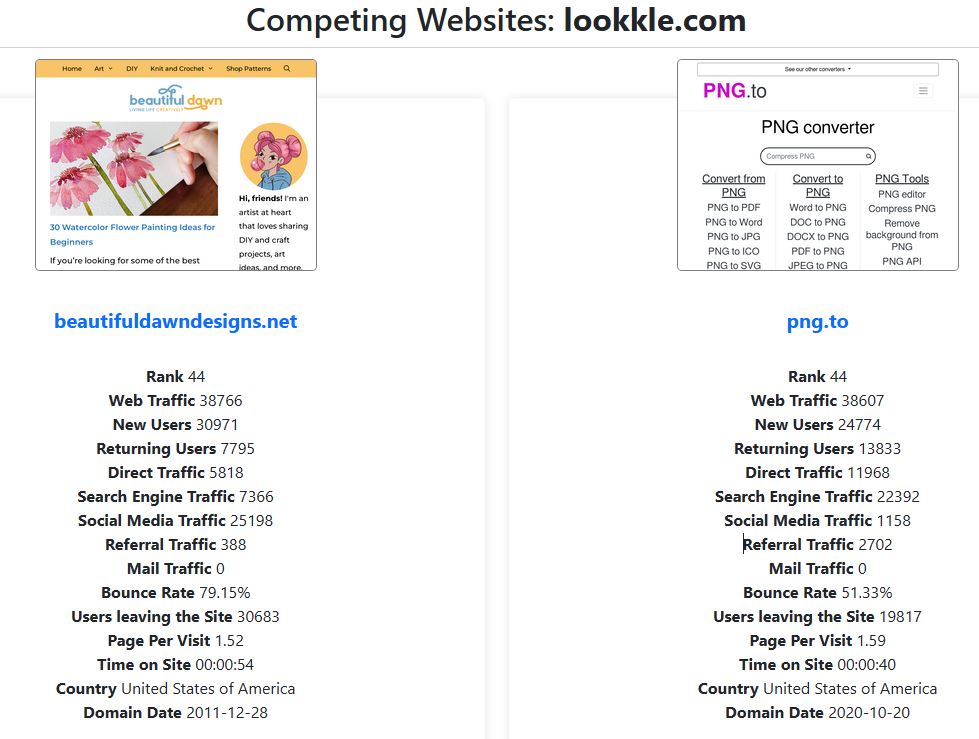
When researching your website’s competition, understanding what each traffic metric means is crucial.
The following data points reveal the strengths, weaknesses, and strategies of your competitors, from SEO performance to user engagement and audience behavior.
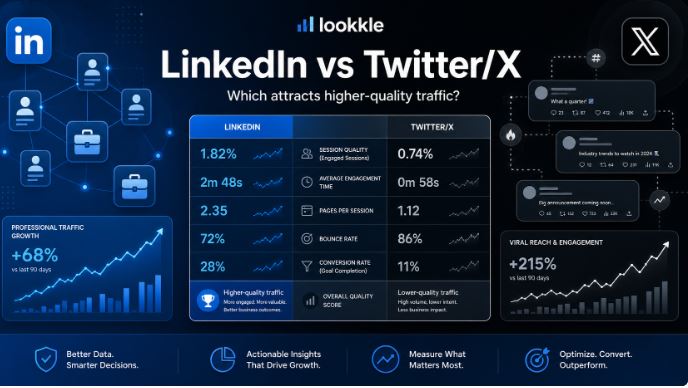
This analysis is based on data displayed by Lookkle's competitor analysis tool.
🧭 1. Ranking
What it measures: The overall domain position (global or country-based) based on traffic and authority.
Conclusion:
-
A high ranking indicates strong visibility and authority.
-
Rising ranks suggest successful SEO or marketing strategies.
-
Falling ranks can indicate traffic loss or reduced relevance.
👉 Comparing rankings helps identify who leads the market and who’s gaining ground.
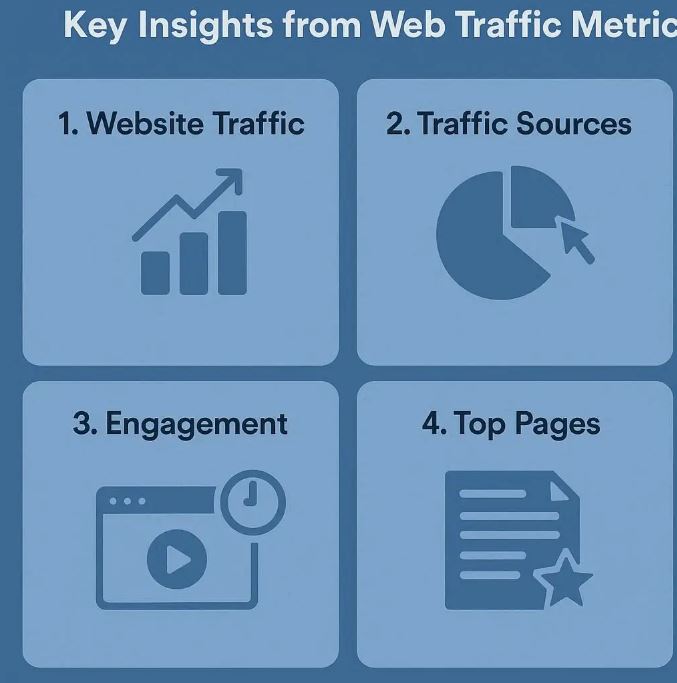
🌐 2. Web Traffic (Total Visits)
What it measures: The total number of website visits within a given period.
Conclusion:
-
High traffic = large audience reach.
-
High traffic with low engagement = low-quality or untargeted visitors.
-
Traffic growth trends reveal which campaigns or content worked.
👉 Track traffic evolution over time to spot emerging competitors.
🆕 3. New Users
What it measures: First-time visitors to the site.
Conclusion:
-
High percentage = strong ability to attract new audiences (good SEO or ads).
-
Low percentage = overreliance on returning users, possible growth stagnation.
👉 The ideal mix: steady new users + loyal returning users.
🔁 4. Returning Users
What it measures: Visitors who come back to the site.
Conclusion:
-
High rate = strong engagement and content value.
-
Low rate = weak retention or lack of loyalty.
👉 Indicates audience loyalty and the effectiveness of your content.
🚪 5. Direct Traffic
What it measures: Visitors typing the URL directly or using bookmarks.
Conclusion:
-
Reflects brand strength and recognition.
-
High rate = strong brand recall.
-
Low rate = dependence on other acquisition channels.
🔍 6. Search Engine Traffic
What it measures: Visitors from search engines (organic traffic).
Conclusion:
-
High value = effective SEO and keyword strategy.
-
Low value = weak organic visibility or overreliance on ads.
👉 Use Lookkle SEO Site Explorer to discover which keywords your competitors rank for.
💬 7. Social Media Traffic
What it measures: Visits coming from social platforms.
Conclusion:
-
High value = active and successful social campaigns.
-
Low value = poor content sharing or weak presence on social channels.
👉 Helps you identify which networks drive the most valuable traffic.
🔗 8. Referral Traffic
What it measures: Traffic from backlinks or external websites.
Conclusion:
-
Shows partnerships, mentions, and link authority.
-
High referral traffic = strong off-page SEO and collaborations.
-
Low referral traffic = limited digital outreach.
👉 Great for finding potential link-building opportunities.
✉️ 9. Email Traffic
What it measures: Visitors from newsletters or email campaigns.
Conclusion:
-
Reflects audience retention and marketing maturity.
-
High value = effective CRM and community engagement.
-
Low value = underused email strategy.
📉 10. Bounce Rate
What it measures: The percentage of users leaving after viewing only one page.
Conclusion:
-
High bounce (>70%) = poor UX, irrelevant content, or misaligned intent.
-
Low bounce (<40%) = users are engaged and exploring.
👉 Benchmark against competitors to see who retains visitors better.
🚪 11. Users Leaving the Site
What it measures: Users exiting without conversion or deeper interaction.
Conclusion:
-
High exit rate = UX issues or poor conversion flow.
-
Low exit rate = optimized, engaging website experience.
📄 12. Pages per Visit
What it measures: Average number of pages viewed per session.
Conclusion:
-
High = strong engagement and site structure.
-
Low = shallow interest or poor internal linking.
👉 Crucial for understanding how deeply users explore competitor content.
⏱️ 13. Time on Site
What it measures: The average time users spend on the website.
Conclusion:
-
Long duration = valuable content and user interest.
-
Short duration = quick bounces or irrelevant content.
👉 Combine with pages per visit to gauge true content quality.
🇺🇸 14. Main Country
What it measures: The country that generates the most traffic.
Conclusion:
-
Shows target audience and market reach.
-
If competitors have strong presence in regions you don’t, that’s an opportunity for expansion.
🗓️ 15. Domain Date (Age)
What it measures: How long the domain has existed.
Conclusion:
-
Older domains often have higher SEO authority.
-
Younger domains with fast growth may signal innovative strategies or viral success.
🧩 Strategic Insights from Combined Metrics
| Strategic Insight | Key Metrics | What It Reveals |
|---|---|---|
| Brand Strength | Direct Traffic + Returning Users | User loyalty and brand awareness |
| SEO Success | Search Traffic + Bounce Rate + Keywords | Organic visibility and content relevance |
| Content Quality | Pages/Visit + Time on Site + Bounce Rate | Engagement and content value |
| Social Media Effectiveness | Social Traffic + New Users | Viral reach and brand buzz |
| Domain Authority | Referral Traffic + Domain Age | Credibility and link profile strength |
| Growth or Decline | Total Traffic + Ranking Trends | Competitive trajectory |
| Geographic Focus | Main Country | Market opportunities |