Reading Time 4
Number of Words 800
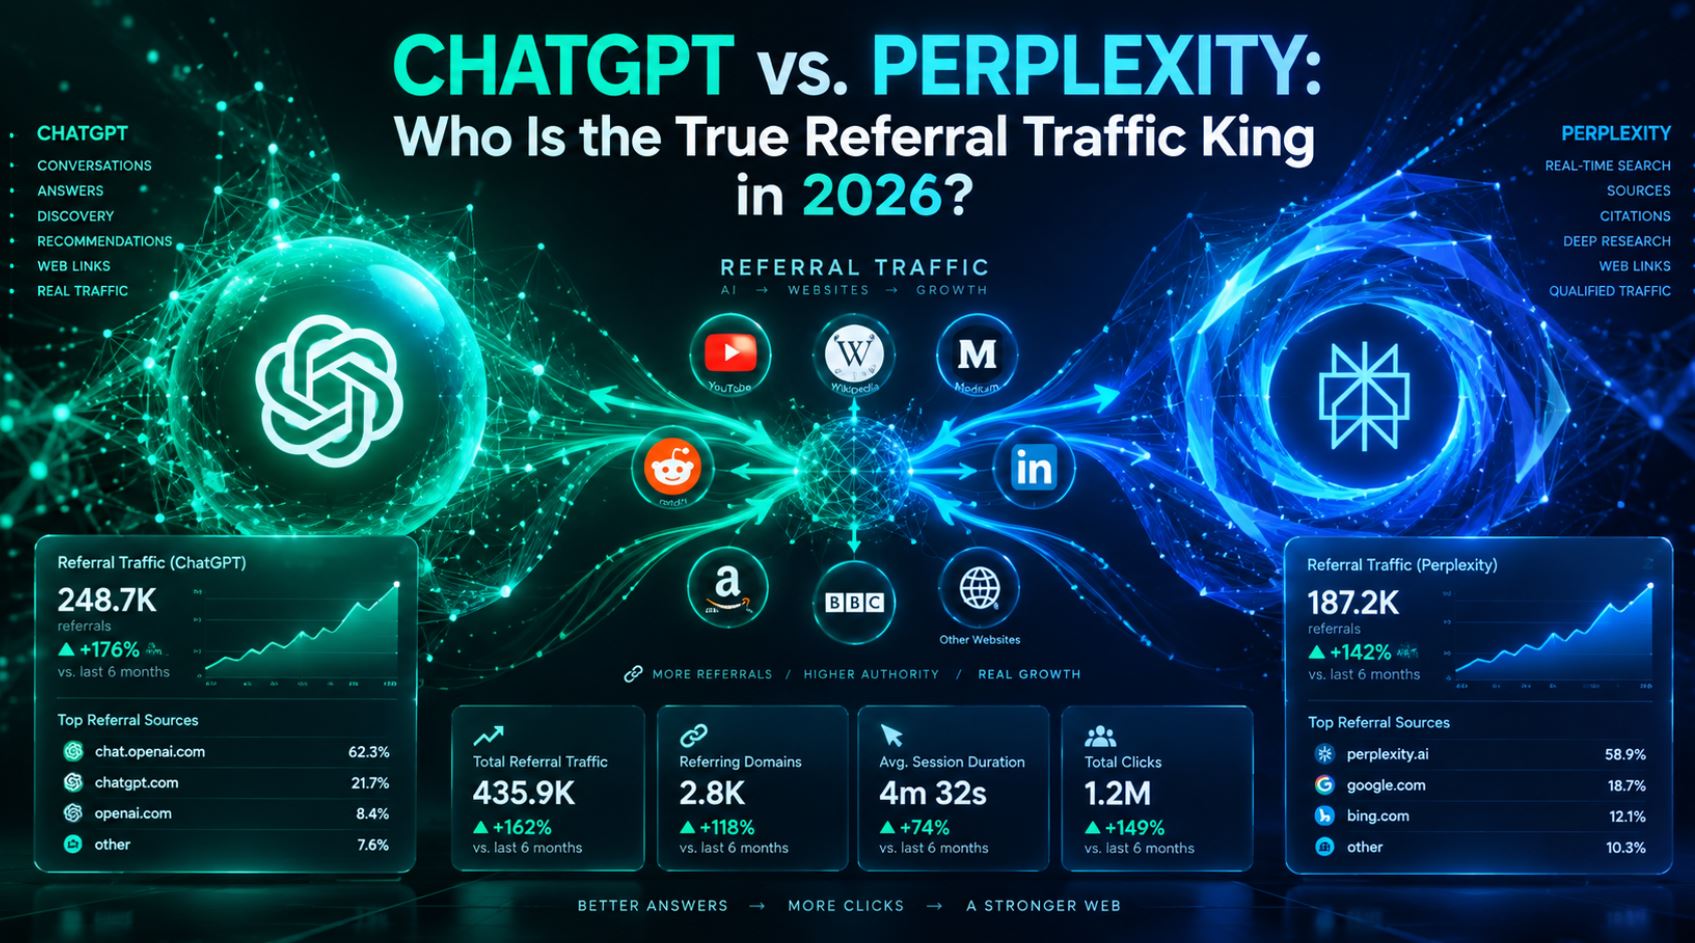
Web telemetry data processed by Lookkle reveals a paradigm shift in the battle between ChatGPT and Perplexity: while ChatGPT crushes it in raw user scale, the dynamics of how they interact with the external web pose profound strategic differences for publishers, SEO professionals, and traffic analysts.
General overview of traffic: scale versus specialization
The monthly volume analyzed as of September 2026 shows that the market share in gross volume continues to be overwhelmingly dominated by the OpenAI ecosystem.
| Key metric (Lookkle) | ChatGPT ( chatgpt.com) |
Perplexity ( perplexity.ai) |
Proportion |
|---|---|---|---|
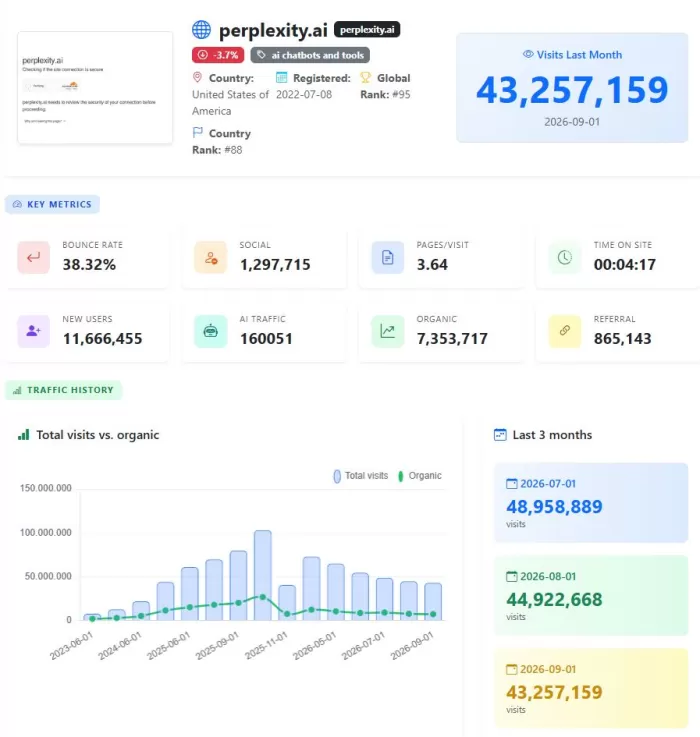
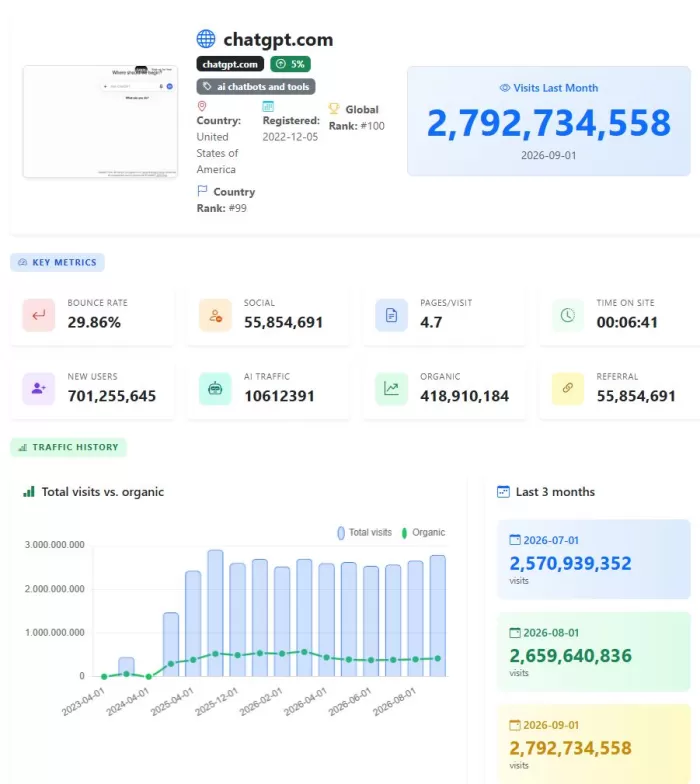
| Monthly visits | 2,792,734,558 (~2,792 M) | 43,257,159 (~43.2 M) | 64.5:1 in favor of ChatGPT |
| New users | 701.255.646 | 11,666,455 | 60:1 |
| Bounce rate | 29.86% | 38.32% | ChatGPT retains +8.46% |
| Pages / Visit | 4.70 | 3.64 | +29.1% in ChatGPT |
| Average time on site | 06:41 min | 04:17 min | +56% increased time spent on ChatGPT |
| Direct Traffic | 76.8% (2,038,696,229) | 75.5% (30,712,584) | Parity in loyalty |
| Organic Traffic (Search) | 15.8% (418,910,184) | 18.1% (7,353,717) | Perplexity relies more on SEO |
| Referral traffic received | 2.1% (55,854,691) | 2.1% (865,143) | Identical percentage rate |
Both tools enjoy a user base with over 75% direct traffic, confirming that they have established themselves as daily access destinations through bookmarks and dedicated applications, partially disintermediating traditional search engines.
Below we show the web traffic data, traffic sources, historical data and other statistical data from Perplexity.ai analyzed by lookkle:
Below we show the web traffic data, traffic sources, historical data and other statistical data of Chatgpt.com analyzed by lookkle:
Referral traffic: Who sends the most visits to websites?
When answering the question of who is the true king of referral traffic to third-party sites and publishers, a critical duality emerges:
1. Absolute gross volume: ChatGPT wins hands down
In net numbers captured by Lookkle, the Referral channel associated with ChatGPT moves 55.85 million monthly sessions (and even 65.62 million according to the overall breakdown), compared to Perplexity's 865,143 - 1.27 million sessions.
Even if a smaller percentage of users click on sources within ChatGPT, its ocean of 2.79 billion monthly visits generates an absolute drag that multiplies by more than 50 times the traffic sent by Perplexity to the open network.
2. Click propensity: Perplexity's qualitative advantage
Although Perplexity has a 64 times smaller user base, its native architecture is that of a citation-based response engine:
-
In Perplexity, each answer is supported by source cards and direct links in the body of the text.
-
Perplexity's higher bounce rate (38.32% vs. 29.86%) and shorter time on page (04:17 vs. 06:41) clearly reflect its transactional nature: the user searches, obtains the source, and clicks to leave the platform and delve deeper into the cited website.
-
ChatGPT functions as a closed conversation system where the vast majority of queries are satisfied internally (zero-click), prolonging the session to almost 7 minutes.
Traffic derived from other AI agents (AI Traffic)
Lookkle monitors cross-traffic between Artificial Intelligence engines (traffic that one model diverts to another).
| Agent of origin | Visits generated towards ChatGPT | Visits generated towards Perplexity |
|---|---|---|
| ChatGPT (proprietary / derivative) | 6,367,435 | 96.031 |
| Gemini | 1,273,487 | 19.206 |
| Grok | 1,061,239 | 16.005 |
| Perplexity | 742,867 | 11.204 |
| Copilot | 424,496 | 6.402 |
| Claude | 424,496 | 6.402 |
| DeepSeek | 106.124 | 1,601 |
| Total AI traffic | 10,612,391 (0.38% of total) | 160,051 (0.37% of total) |
The relative proportion of AI-assisted traffic is virtually identical on both platforms ( 0.38% vs. 0.37% ), demonstrating that automated or referred navigation between AI tools still represents a contained fraction of the global ecosystem.
Demographic and device profile
Demographic analysis on Lookkle reveals virtually symmetrical audience patterns:
-
Devices: Mobile phones dominate with a 61% market share, followed by desktop at 34% and tablets at 5% across both platforms. This underscores the need for AI response engine optimization to prioritize mobile interfaces.
-
Operating systems: Android leads with 44%, followed by iOS with 30% and Windows with 16%.
-
Browsers: Google Chrome absorbs 65% of the traffic in both domains, with Safari retaining 20%.
-
Inbound search engines: When users search for these tools organically, Google channels 91% of organic traffic, with Bing contributing a distant 4%.
-
Geography: The United States represents the main market (21.07% in ChatGPT and 25.13% in Perplexity), with India as the second stronghold (9.69% in ChatGPT and 8.20% in Perplexity).
Conclusions for editors and SEOs in 2026
-
ChatGPT is the king of absolute volume: With nearly 2.8 billion monthly visits and over 55 million referral visits, gaining visibility on ChatGPT Search brings a quantitative flow that no other AI engine currently matches.
-
Perplexity is the king of qualified traffic: Despite having 43 million monthly visits, the search intent of its users is geared towards verifying sources through outbound links, making it a channel with a higher conversion rate per click for specialized media and niches.
-
Mandatory dual strategy: AI engine positioning (GEO/AIO) cannot ignore ChatGPT's massive reach, but requires prioritizing indexing and citability on Perplexity to capture traffic with high purchase intent and technical research.